class: right, middle, my-title, title-slide # Mid-Atlantic Ecosystem Approach ## MSE workshop background <br /> March-April 2021 ### Sarah Gaichas, Geret DePiper, Brandon Muffley, Richard Seagraves <br /> Northeast Fisheries Science Center, Mid-Atlantic Fishery Management Council --- class: top, left ## Mid-Atlantic Council Ecosysytem Approach (work in progress) Diverse stakeholders agreed that an ecosystem approach was necessary. Developing and implementing an ecosystem approach to fishery management was done in collaboration between managers, stakeholders, and scientists. .pull-left[ *Outline* - Mid-Atlantic Fishery Management Council Ecosystem Approach (EAFM) - Mid-Atlantic EAFM indicator-based risk assessment - Mid-Atlantic EAFM conceptual modeling (towards MSE) ] .pull-right[ *Integrated Ecosystem Assessment*  .image-cap[ https://www.integratedecosystemassessment.noaa.gov/national/IEA-approach ] ] ??? --- ## Mid-Atlantic Council Ecosystem Approach * 2016 Ecosystem Approach to Fishery Management (EAFM) Policy Guidance document: http://www.mafmc.org/s/EAFM-Doc-Revised-2019-02-08.pdf * Mid-Atlantic EAFM framework: .center[ 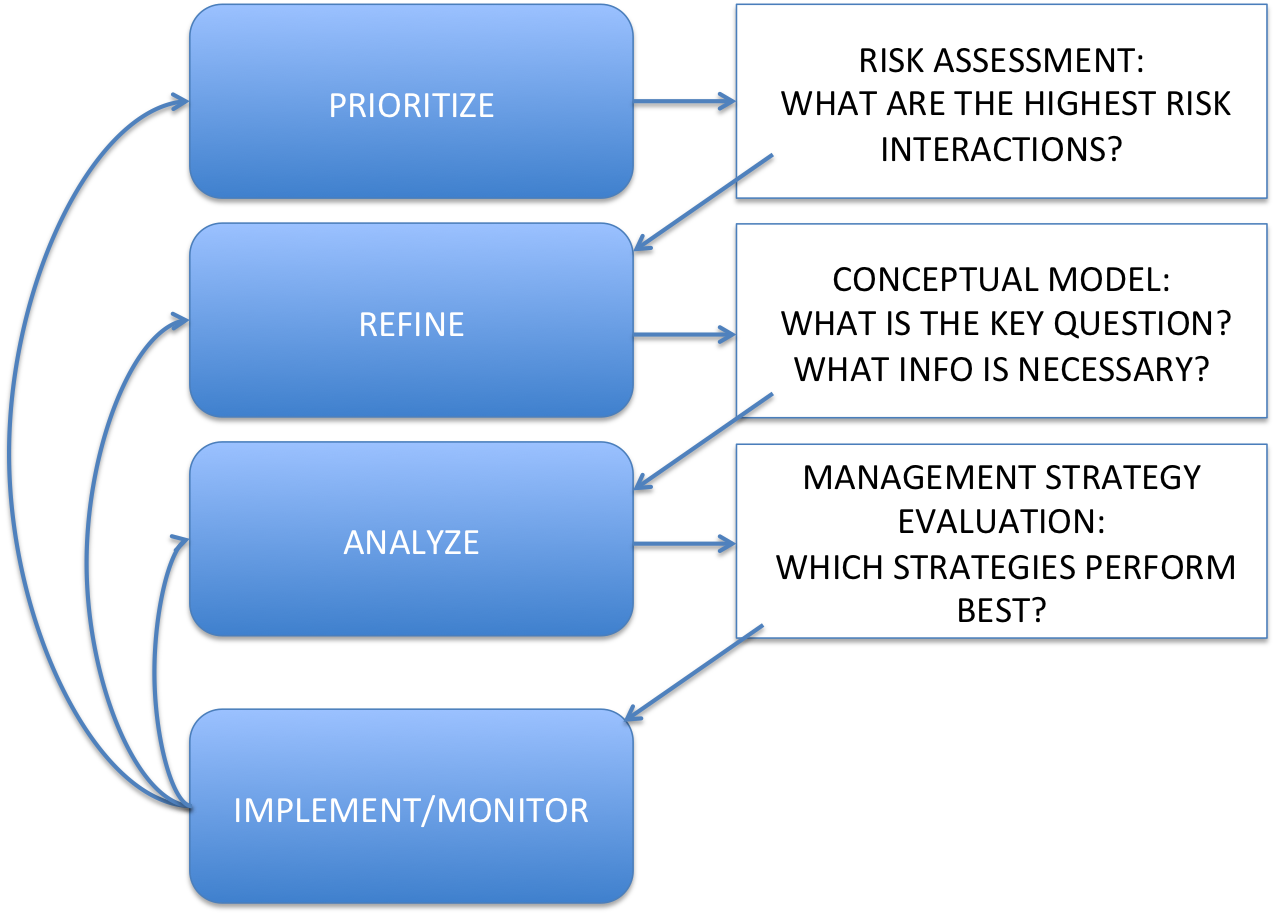 ] ??? The Council’s EAFM framework has similarities to the IEA loop on slide 2. It uses risk assessment as a first step to prioritize combinations of managed species, fleets, and ecosystem interactions for consideration. Second, a conceptual model is developed identifying key environmental, ecological, social, economic, and management linkages for a high-priority fishery. Third, quantitative modeling addressing Council-specified questions and based on interactions identified in the conceptual model is applied to evaluate alternative management strategies that best balance management objectives. As strategies are implemented, outcomes are monitored and the process is adjusted, and/or another priority identified in risk assessment can be addressed. --- ## Iterative development of the risk assessment .pull-left-40[ 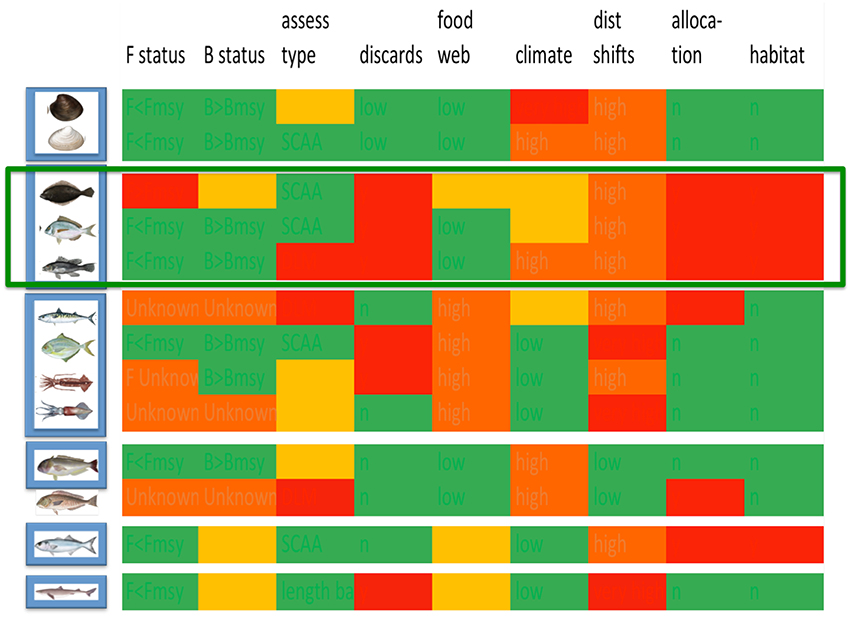 * Council staff and scientists create examples based on Council input ↑ ↓ ↑ ↓ ↑ ↓ ↑ ↓ ↑ ↓ ↑ ↓ ... * Council discusses, clarifies, revises with public input ] .pull-right-60[ <table class="table table-striped table-condensed" style="font-size: 13px; margin-left: auto; margin-right: auto;"> <thead> <tr> <th style="text-align:left;"> Element </th> <th style="text-align:left;"> Definition </th> <th style="text-align:left;"> Indicators </th> </tr> </thead> <tbody> <tr grouplength="4"><td colspan="3" style="border-bottom: 1px solid;"><strong>Economic</strong></td></tr> <tr> <td style="text-align:left;padding-left: 2em;" indentlevel="1"> Commercial Revenue </td> <td style="text-align:left;"> Risk of not maximizing fishery value </td> <td style="text-align:left;"> Revenue in aggregate </td> </tr> <tr> <td style="text-align:left;padding-left: 2em;" indentlevel="1"> Recreational Angler Days/Trips </td> <td style="text-align:left;"> Risk of not maximizing fishery value </td> <td style="text-align:left;"> Numbers of anglers and trips in aggregate </td> </tr> <tr> <td style="text-align:left;padding-left: 2em;" indentlevel="1"> Commercial Fishery Resilience (Revenue Diversity) </td> <td style="text-align:left;"> Risk of reduced fishery business resilience </td> <td style="text-align:left;"> Species diversity of revenue </td> </tr> <tr> <td style="text-align:left;padding-left: 2em;" indentlevel="1"> Commercial Fishery Resilience (Shoreside Support) </td> <td style="text-align:left;"> Risk of reduced fishery business resilience due to shoreside support infrastructure </td> <td style="text-align:left;"> Number of shoreside support businesses </td> </tr> <tr grouplength="2"><td colspan="3" style="border-bottom: 1px solid;"><strong>Social</strong></td></tr> <tr> <td style="text-align:left;padding-left: 2em;" indentlevel="1"> Fleet Resilience </td> <td style="text-align:left;"> Risk of reduced fishery resilience </td> <td style="text-align:left;"> Number of fleets, fleet diversity </td> </tr> <tr> <td style="text-align:left;padding-left: 2em;" indentlevel="1"> Social-Cultural </td> <td style="text-align:left;"> Risk of reduced community resilience </td> <td style="text-align:left;"> Community vulnerability, fishery engagement and reliance </td> </tr> <tr grouplength="2"><td colspan="3" style="border-bottom: 1px solid;"><strong>Food Production</strong></td></tr> <tr> <td style="text-align:left;padding-left: 2em;" indentlevel="1"> Commercial </td> <td style="text-align:left;"> Risk of not optimizing seafood production </td> <td style="text-align:left;"> Seafood landings in aggregate </td> </tr> <tr> <td style="text-align:left;padding-left: 2em;" indentlevel="1"> Recreational </td> <td style="text-align:left;"> Risk of not maintaining personal food production </td> <td style="text-align:left;"> Recreational landings in aggregate </td> </tr> </tbody> </table> ] --- ## Risk elements: Management <table class="table table-striped table-condensed" style="font-size: 14px; margin-left: auto; margin-right: auto;"> <thead> <tr> <th style="text-align:left;"> Element </th> <th style="text-align:left;"> Definition </th> <th style="text-align:left;"> Indicators </th> </tr> </thead> <tbody> <tr grouplength="6"><td colspan="3" style="border-bottom: 1px solid;"><strong>Management</strong></td></tr> <tr> <td style="text-align:left;padding-left: 2em;" indentlevel="1"> Control </td> <td style="text-align:left;"> Risk of not achieving OY due to inadequate control </td> <td style="text-align:left;"> Catch compared to allocation </td> </tr> <tr> <td style="text-align:left;padding-left: 2em;" indentlevel="1"> Interactions </td> <td style="text-align:left;"> Risk of not achieving OY due to interactions with species managed by other entities </td> <td style="text-align:left;"> Number and type of interactions with protected or non-MAFMC managed species, co-management </td> </tr> <tr> <td style="text-align:left;padding-left: 2em;" indentlevel="1"> Other ocean uses </td> <td style="text-align:left;"> Risk of not achieving OY due to other human uses </td> <td style="text-align:left;"> Fishery overlap with energy/mining areas </td> </tr> <tr> <td style="text-align:left;padding-left: 2em;" indentlevel="1"> Regulatory complexity </td> <td style="text-align:left;"> Risk of not achieving compliance due to complexity </td> <td style="text-align:left;"> Number of regulations by species </td> </tr> <tr> <td style="text-align:left;padding-left: 2em;" indentlevel="1"> Discards </td> <td style="text-align:left;"> Risk of not minimizing bycatch to extent practicable </td> <td style="text-align:left;"> Standardized Bycatch Reporting </td> </tr> <tr> <td style="text-align:left;padding-left: 2em;" indentlevel="1"> Allocation </td> <td style="text-align:left;"> Risk of not achieving OY due to spatial mismatch of stocks and management </td> <td style="text-align:left;"> Distribution shifts + number of interests </td> </tr> </tbody> </table> --- ## Risk assessent indicators and ranking criteria example: Commercial revenue This element is applied at the ecosystem level. Revenue serves as a proxy for commercial profits. .table[ .pull-left[ <table> <thead> <tr> <th style="text-align:left;"> Risk Level </th> <th style="text-align:left;"> Definition </th> </tr> </thead> <tbody> <tr> <td style="text-align:left;width: 20em; "> Low </td> <td style="text-align:left;width: 20em; "> No trend and low variability in revenue </td> </tr> <tr> <td style="text-align:left;width: 20em; "> Low-Moderate </td> <td style="text-align:left;width: 20em; "> Increasing or high variability in revenue </td> </tr> <tr> <td style="text-align:left;width: 20em; font-weight: bold;background-color: orange !important;"> Moderate-High </td> <td style="text-align:left;width: 20em; font-weight: bold;background-color: orange !important;"> Significant long term revenue decrease </td> </tr> <tr> <td style="text-align:left;width: 20em; "> High </td> <td style="text-align:left;width: 20em; "> Significant recent decrease in revenue </td> </tr> </tbody> </table> Ranked moderate-high risk due to the significant long term revenue decrease for Mid-Atlantic managed species (red points in top plot) ] ] .pull-right[ 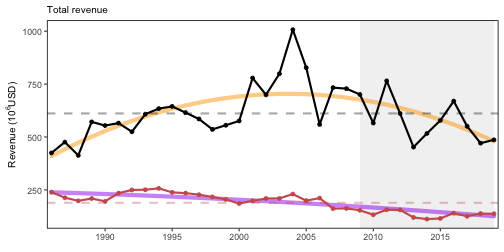<!-- --> Key: Black = Revenue of all species combined; <p style="color:#FF6A6A;">Red = Revenue of MAFMC managed species</p> ] --- ## EAFM Risk Assessment: 2021 Update .pull-left[ *Species level risk elements* <table class="risktable table" style="font-size: 9px; margin-left: auto; margin-right: auto;"> <thead> <tr> <th style="text-align:left;"> Species </th> <th style="text-align:left;"> Assess </th> <th style="text-align:left;"> Fstatus </th> <th style="text-align:left;"> Bstatus </th> <th style="text-align:left;"> FW1Pred </th> <th style="text-align:left;"> FW1Prey </th> <th style="text-align:left;"> FW2Prey </th> <th style="text-align:left;"> Climate </th> <th style="text-align:left;"> DistShift </th> <th style="text-align:left;"> EstHabitat </th> </tr> </thead> <tbody> <tr> <td style="text-align:left;"> Ocean Quahog </td> <td style="text-align:left;"> <span style=" color: black !important;padding-right: 4px; padding-left: 4px; background-color: lightgreen !important;text-align: c;">lowest</span> </td> <td style="text-align:left;"> <span style=" color: black !important;padding-right: 4px; padding-left: 4px; background-color: lightgreen !important;text-align: c;">lowest</span> </td> <td style="text-align:left;"> <span style=" color: black !important;padding-right: 4px; padding-left: 4px; background-color: lightgreen !important;text-align: c;">lowest</span> </td> <td style="text-align:left;"> <span style=" color: black !important;padding-right: 4px; padding-left: 4px; background-color: lightgreen !important;text-align: c;">lowest</span> </td> <td style="text-align:left;"> <span style=" color: black !important;padding-right: 4px; padding-left: 4px; background-color: lightgreen !important;text-align: c;">lowest</span> </td> <td style="text-align:left;"> <span style=" color: black !important;padding-right: 4px; padding-left: 4px; background-color: lightgreen !important;text-align: c;">lowest</span> </td> <td style="text-align:left;"> <span style=" color: white !important;padding-right: 4px; padding-left: 4px; background-color: red !important;text-align: c;">highest</span> </td> <td style="text-align:left;"> <span style=" color: black !important;padding-right: 4px; padding-left: 4px; background-color: orange !important;text-align: c;">modhigh</span> </td> <td style="text-align:left;"> <span style=" color: black !important;padding-right: 4px; padding-left: 4px; background-color: lightgreen !important;text-align: c;">lowest</span> </td> </tr> <tr> <td style="text-align:left;"> Surfclam </td> <td style="text-align:left;"> <span style=" color: black !important;padding-right: 4px; padding-left: 4px; background-color: lightgreen !important;text-align: c;">lowest</span> </td> <td style="text-align:left;"> <span style=" color: black !important;padding-right: 4px; padding-left: 4px; background-color: lightgreen !important;text-align: c;">lowest</span> </td> <td style="text-align:left;"> <span style=" color: black !important;padding-right: 4px; padding-left: 4px; background-color: lightgreen !important;text-align: c;">lowest</span> </td> <td style="text-align:left;"> <span style=" color: black !important;padding-right: 4px; padding-left: 4px; background-color: lightgreen !important;text-align: c;">lowest</span> </td> <td style="text-align:left;"> <span style=" color: black !important;padding-right: 4px; padding-left: 4px; background-color: lightgreen !important;text-align: c;">lowest</span> </td> <td style="text-align:left;"> <span style=" color: black !important;padding-right: 4px; padding-left: 4px; background-color: lightgreen !important;text-align: c;">lowest</span> </td> <td style="text-align:left;"> <span style=" color: black !important;padding-right: 4px; padding-left: 4px; background-color: orange !important;text-align: c;">modhigh</span> </td> <td style="text-align:left;"> <span style=" color: black !important;padding-right: 4px; padding-left: 4px; background-color: orange !important;text-align: c;">modhigh</span> </td> <td style="text-align:left;"> <span style=" color: black !important;padding-right: 4px; padding-left: 4px; background-color: lightgreen !important;text-align: c;">lowest</span> </td> </tr> <tr> <td style="text-align:left;"> Summer flounder </td> <td style="text-align:left;"> <span style=" color: black !important;padding-right: 4px; padding-left: 4px; background-color: lightgreen !important;text-align: c;">lowest</span> </td> <td style="text-align:left;"> <span style=" color: black !important;padding-right: 4px; padding-left: 4px; background-color: lightgreen !important;text-align: c;">lowest</span> </td> <td style="text-align:left;"> <span style=" color: black !important;padding-right: 4px; padding-left: 4px; background-color: yellow !important;text-align: c;">lowmod</span> </td> <td style="text-align:left;"> <span style=" color: black !important;padding-right: 4px; padding-left: 4px; background-color: lightgreen !important;text-align: c;">lowest</span> </td> <td style="text-align:left;"> <span style=" color: black !important;padding-right: 4px; padding-left: 4px; background-color: lightgreen !important;text-align: c;">lowest</span> </td> <td style="text-align:left;"> <span style=" color: black !important;padding-right: 4px; padding-left: 4px; background-color: lightgreen !important;text-align: c;">lowest</span> </td> <td style="text-align:left;"> <span style=" color: black !important;padding-right: 4px; padding-left: 4px; background-color: yellow !important;text-align: c;">lowmod</span> </td> <td style="text-align:left;"> <span style=" color: black !important;padding-right: 4px; padding-left: 4px; background-color: orange !important;text-align: c;">modhigh</span> </td> <td style="text-align:left;"> <span style=" color: white !important;padding-right: 4px; padding-left: 4px; background-color: red !important;text-align: c;">highest</span> </td> </tr> <tr> <td style="text-align:left;"> Scup </td> <td style="text-align:left;"> <span style=" color: black !important;padding-right: 4px; padding-left: 4px; background-color: lightgreen !important;text-align: c;">lowest</span> </td> <td style="text-align:left;"> <span style=" color: black !important;padding-right: 4px; padding-left: 4px; background-color: lightgreen !important;text-align: c;">lowest</span> </td> <td style="text-align:left;"> <span style=" color: black !important;padding-right: 4px; padding-left: 4px; background-color: lightgreen !important;text-align: c;">lowest</span> </td> <td style="text-align:left;"> <span style=" color: black !important;padding-right: 4px; padding-left: 4px; background-color: lightgreen !important;text-align: c;">lowest</span> </td> <td style="text-align:left;"> <span style=" color: black !important;padding-right: 4px; padding-left: 4px; background-color: lightgreen !important;text-align: c;">lowest</span> </td> <td style="text-align:left;"> <span style=" color: black !important;padding-right: 4px; padding-left: 4px; background-color: lightgreen !important;text-align: c;">lowest</span> </td> <td style="text-align:left;"> <span style=" color: black !important;padding-right: 4px; padding-left: 4px; background-color: yellow !important;text-align: c;">lowmod</span> </td> <td style="text-align:left;"> <span style=" color: black !important;padding-right: 4px; padding-left: 4px; background-color: orange !important;text-align: c;">modhigh</span> </td> <td style="text-align:left;"> <span style=" color: white !important;padding-right: 4px; padding-left: 4px; background-color: red !important;text-align: c;">highest</span> </td> </tr> <tr> <td style="text-align:left;"> Black sea bass </td> <td style="text-align:left;"> <span style=" color: black !important;padding-right: 4px; padding-left: 4px; background-color: lightgreen !important;text-align: c;">lowest</span> </td> <td style="text-align:left;"> <span style=" color: black !important;padding-right: 4px; padding-left: 4px; background-color: lightgreen !important;text-align: c;">lowest</span> </td> <td style="text-align:left;"> <span style=" color: black !important;padding-right: 4px; padding-left: 4px; background-color: lightgreen !important;text-align: c;">lowest</span> </td> <td style="text-align:left;"> <span style=" color: black !important;padding-right: 4px; padding-left: 4px; background-color: lightgreen !important;text-align: c;">lowest</span> </td> <td style="text-align:left;"> <span style=" color: black !important;padding-right: 4px; padding-left: 4px; background-color: lightgreen !important;text-align: c;">lowest</span> </td> <td style="text-align:left;"> <span style=" color: black !important;padding-right: 4px; padding-left: 4px; background-color: lightgreen !important;text-align: c;">lowest</span> </td> <td style="text-align:left;"> <span style=" color: black !important;padding-right: 4px; padding-left: 4px; background-color: orange !important;text-align: c;">modhigh</span> </td> <td style="text-align:left;"> <span style=" color: black !important;padding-right: 4px; padding-left: 4px; background-color: orange !important;text-align: c;">modhigh</span> </td> <td style="text-align:left;"> <span style=" color: white !important;padding-right: 4px; padding-left: 4px; background-color: red !important;text-align: c;">highest</span> </td> </tr> <tr> <td style="text-align:left;"> Atl. mackerel </td> <td style="text-align:left;"> <span style=" color: black !important;padding-right: 4px; padding-left: 4px; background-color: lightgreen !important;text-align: c;">lowest</span> </td> <td style="text-align:left;"> <span style=" color: white !important;padding-right: 4px; padding-left: 4px; background-color: red !important;text-align: c;">highest</span> </td> <td style="text-align:left;"> <span style=" color: white !important;padding-right: 4px; padding-left: 4px; background-color: red !important;text-align: c;">highest</span> </td> <td style="text-align:left;"> <span style=" color: black !important;padding-right: 4px; padding-left: 4px; background-color: lightgreen !important;text-align: c;">lowest</span> </td> <td style="text-align:left;"> <span style=" color: black !important;padding-right: 4px; padding-left: 4px; background-color: lightgreen !important;text-align: c;">lowest</span> </td> <td style="text-align:left;"> <span style=" color: black !important;padding-right: 4px; padding-left: 4px; background-color: lightgreen !important;text-align: c;">lowest</span> </td> <td style="text-align:left;"> <span style=" color: black !important;padding-right: 4px; padding-left: 4px; background-color: yellow !important;text-align: c;">lowmod</span> </td> <td style="text-align:left;"> <span style=" color: black !important;padding-right: 4px; padding-left: 4px; background-color: orange !important;text-align: c;">modhigh</span> </td> <td style="text-align:left;"> <span style=" color: black !important;padding-right: 4px; padding-left: 4px; background-color: lightgreen !important;text-align: c;">lowest</span> </td> </tr> <tr> <td style="text-align:left;"> Butterfish </td> <td style="text-align:left;"> <span style=" color: black !important;padding-right: 4px; padding-left: 4px; background-color: lightgreen !important;text-align: c;">lowest</span> </td> <td style="text-align:left;"> <span style=" color: black !important;padding-right: 4px; padding-left: 4px; background-color: lightgreen !important;text-align: c;">lowest</span> </td> <td style="text-align:left;"> <span style=" color: black !important;padding-right: 4px; padding-left: 4px; background-color: yellow !important;text-align: c;">lowmod</span> </td> <td style="text-align:left;"> <span style=" color: black !important;padding-right: 4px; padding-left: 4px; background-color: lightgreen !important;text-align: c;">lowest</span> </td> <td style="text-align:left;"> <span style=" color: black !important;padding-right: 4px; padding-left: 4px; background-color: lightgreen !important;text-align: c;">lowest</span> </td> <td style="text-align:left;"> <span style=" color: black !important;padding-right: 4px; padding-left: 4px; background-color: lightgreen !important;text-align: c;">lowest</span> </td> <td style="text-align:left;"> <span style=" color: black !important;padding-right: 4px; padding-left: 4px; background-color: lightgreen !important;text-align: c;">lowest</span> </td> <td style="text-align:left;"> <span style=" color: white !important;padding-right: 4px; padding-left: 4px; background-color: red !important;text-align: c;">highest</span> </td> <td style="text-align:left;"> <span style=" color: black !important;padding-right: 4px; padding-left: 4px; background-color: lightgreen !important;text-align: c;">lowest</span> </td> </tr> <tr> <td style="text-align:left;"> Longfin squid </td> <td style="text-align:left;"> <span style=" color: black !important;padding-right: 4px; padding-left: 4px; background-color: yellow !important;text-align: c;">lowmod</span> </td> <td style="text-align:left;"> <span style=" color: black !important;padding-right: 4px; padding-left: 4px; background-color: yellow !important;text-align: c;">lowmod</span> </td> <td style="text-align:left;"> <span style=" color: black !important;padding-right: 4px; padding-left: 4px; background-color: yellow !important;text-align: c;">lowmod</span> </td> <td style="text-align:left;"> <span style=" color: black !important;padding-right: 4px; padding-left: 4px; background-color: lightgreen !important;text-align: c;">lowest</span> </td> <td style="text-align:left;"> <span style=" color: black !important;padding-right: 4px; padding-left: 4px; background-color: lightgreen !important;text-align: c;">lowest</span> </td> <td style="text-align:left;"> <span style=" color: black !important;padding-right: 4px; padding-left: 4px; background-color: yellow !important;text-align: c;">lowmod</span> </td> <td style="text-align:left;"> <span style=" color: black !important;padding-right: 4px; padding-left: 4px; background-color: lightgreen !important;text-align: c;">lowest</span> </td> <td style="text-align:left;"> <span style=" color: black !important;padding-right: 4px; padding-left: 4px; background-color: orange !important;text-align: c;">modhigh</span> </td> <td style="text-align:left;"> <span style=" color: black !important;padding-right: 4px; padding-left: 4px; background-color: lightgreen !important;text-align: c;">lowest</span> </td> </tr> <tr> <td style="text-align:left;"> Shortfin squid </td> <td style="text-align:left;"> <span style=" color: black !important;padding-right: 4px; padding-left: 4px; background-color: yellow !important;text-align: c;">lowmod</span> </td> <td style="text-align:left;"> <span style=" color: black !important;padding-right: 4px; padding-left: 4px; background-color: yellow !important;text-align: c;">lowmod</span> </td> <td style="text-align:left;"> <span style=" color: black !important;padding-right: 4px; padding-left: 4px; background-color: yellow !important;text-align: c;">lowmod</span> </td> <td style="text-align:left;"> <span style=" color: black !important;padding-right: 4px; padding-left: 4px; background-color: lightgreen !important;text-align: c;">lowest</span> </td> <td style="text-align:left;"> <span style=" color: black !important;padding-right: 4px; padding-left: 4px; background-color: lightgreen !important;text-align: c;">lowest</span> </td> <td style="text-align:left;"> <span style=" color: black !important;padding-right: 4px; padding-left: 4px; background-color: yellow !important;text-align: c;">lowmod</span> </td> <td style="text-align:left;"> <span style=" color: black !important;padding-right: 4px; padding-left: 4px; background-color: lightgreen !important;text-align: c;">lowest</span> </td> <td style="text-align:left;"> <span style=" color: white !important;padding-right: 4px; padding-left: 4px; background-color: red !important;text-align: c;">highest</span> </td> <td style="text-align:left;"> <span style=" color: black !important;padding-right: 4px; padding-left: 4px; background-color: lightgreen !important;text-align: c;">lowest</span> </td> </tr> <tr> <td style="text-align:left;"> Golden tilefish </td> <td style="text-align:left;"> <span style=" color: black !important;padding-right: 4px; padding-left: 4px; background-color: lightgreen !important;text-align: c;">lowest</span> </td> <td style="text-align:left;"> <span style=" color: black !important;padding-right: 4px; padding-left: 4px; background-color: lightgreen !important;text-align: c;">lowest</span> </td> <td style="text-align:left;"> <span style=" color: black !important;padding-right: 4px; padding-left: 4px; background-color: yellow !important;text-align: c;">lowmod</span> </td> <td style="text-align:left;"> <span style=" color: black !important;padding-right: 4px; padding-left: 4px; background-color: lightgreen !important;text-align: c;">lowest</span> </td> <td style="text-align:left;"> <span style=" color: black !important;padding-right: 4px; padding-left: 4px; background-color: lightgreen !important;text-align: c;">lowest</span> </td> <td style="text-align:left;"> <span style=" color: black !important;padding-right: 4px; padding-left: 4px; background-color: lightgreen !important;text-align: c;">lowest</span> </td> <td style="text-align:left;"> <span style=" color: black !important;padding-right: 4px; padding-left: 4px; background-color: orange !important;text-align: c;">modhigh</span> </td> <td style="text-align:left;"> <span style=" color: black !important;padding-right: 4px; padding-left: 4px; background-color: lightgreen !important;text-align: c;">lowest</span> </td> <td style="text-align:left;"> <span style=" color: black !important;padding-right: 4px; padding-left: 4px; background-color: lightgreen !important;text-align: c;">lowest</span> </td> </tr> <tr> <td style="text-align:left;"> Blueline tilefish </td> <td style="text-align:left;"> <span style=" color: white !important;padding-right: 4px; padding-left: 4px; background-color: red !important;text-align: c;">highest</span> </td> <td style="text-align:left;"> <span style=" color: white !important;padding-right: 4px; padding-left: 4px; background-color: red !important;text-align: c;">highest</span> </td> <td style="text-align:left;"> <span style=" color: black !important;padding-right: 4px; padding-left: 4px; background-color: orange !important;text-align: c;">modhigh</span> </td> <td style="text-align:left;"> <span style=" color: black !important;padding-right: 4px; padding-left: 4px; background-color: lightgreen !important;text-align: c;">lowest</span> </td> <td style="text-align:left;"> <span style=" color: black !important;padding-right: 4px; padding-left: 4px; background-color: lightgreen !important;text-align: c;">lowest</span> </td> <td style="text-align:left;"> <span style=" color: black !important;padding-right: 4px; padding-left: 4px; background-color: lightgreen !important;text-align: c;">lowest</span> </td> <td style="text-align:left;"> <span style=" color: black !important;padding-right: 4px; padding-left: 4px; background-color: orange !important;text-align: c;">modhigh</span> </td> <td style="text-align:left;"> <span style=" color: black !important;padding-right: 4px; padding-left: 4px; background-color: lightgreen !important;text-align: c;">lowest</span> </td> <td style="text-align:left;"> <span style=" color: black !important;padding-right: 4px; padding-left: 4px; background-color: lightgreen !important;text-align: c;">lowest</span> </td> </tr> <tr> <td style="text-align:left;"> Bluefish </td> <td style="text-align:left;"> <span style=" color: black !important;padding-right: 4px; padding-left: 4px; background-color: lightgreen !important;text-align: c;">lowest</span> </td> <td style="text-align:left;"> <span style=" color: black !important;padding-right: 4px; padding-left: 4px; background-color: lightgreen !important;text-align: c;">lowest</span> </td> <td style="text-align:left;"> <span style=" color: white !important;padding-right: 4px; padding-left: 4px; background-color: red !important;text-align: c;">highest</span> </td> <td style="text-align:left;"> <span style=" color: black !important;padding-right: 4px; padding-left: 4px; background-color: lightgreen !important;text-align: c;">lowest</span> </td> <td style="text-align:left;"> <span style=" color: black !important;padding-right: 4px; padding-left: 4px; background-color: lightgreen !important;text-align: c;">lowest</span> </td> <td style="text-align:left;"> <span style=" color: black !important;padding-right: 4px; padding-left: 4px; background-color: lightgreen !important;text-align: c;">lowest</span> </td> <td style="text-align:left;"> <span style=" color: black !important;padding-right: 4px; padding-left: 4px; background-color: lightgreen !important;text-align: c;">lowest</span> </td> <td style="text-align:left;"> <span style=" color: black !important;padding-right: 4px; padding-left: 4px; background-color: orange !important;text-align: c;">modhigh</span> </td> <td style="text-align:left;"> <span style=" color: white !important;padding-right: 4px; padding-left: 4px; background-color: red !important;text-align: c;">highest</span> </td> </tr> <tr> <td style="text-align:left;"> Spiny dogfish </td> <td style="text-align:left;"> <span style=" color: black !important;padding-right: 4px; padding-left: 4px; background-color: yellow !important;text-align: c;">lowmod</span> </td> <td style="text-align:left;"> <span style=" color: black !important;padding-right: 4px; padding-left: 4px; background-color: lightgreen !important;text-align: c;">lowest</span> </td> <td style="text-align:left;"> <span style=" color: black !important;padding-right: 4px; padding-left: 4px; background-color: yellow !important;text-align: c;">lowmod</span> </td> <td style="text-align:left;"> <span style=" color: black !important;padding-right: 4px; padding-left: 4px; background-color: lightgreen !important;text-align: c;">lowest</span> </td> <td style="text-align:left;"> <span style=" color: black !important;padding-right: 4px; padding-left: 4px; background-color: lightgreen !important;text-align: c;">lowest</span> </td> <td style="text-align:left;"> <span style=" color: black !important;padding-right: 4px; padding-left: 4px; background-color: lightgreen !important;text-align: c;">lowest</span> </td> <td style="text-align:left;"> <span style=" color: black !important;padding-right: 4px; padding-left: 4px; background-color: lightgreen !important;text-align: c;">lowest</span> </td> <td style="text-align:left;"> <span style=" color: white !important;padding-right: 4px; padding-left: 4px; background-color: red !important;text-align: c;">highest</span> </td> <td style="text-align:left;"> <span style=" color: black !important;padding-right: 4px; padding-left: 4px; background-color: lightgreen !important;text-align: c;">lowest</span> </td> </tr> <tr> <td style="text-align:left;"> Monkfish </td> <td style="text-align:left;"> <span style=" color: white !important;padding-right: 4px; padding-left: 4px; background-color: red !important;text-align: c;">highest</span> </td> <td style="text-align:left;"> <span style=" color: black !important;padding-right: 4px; padding-left: 4px; background-color: yellow !important;text-align: c;">lowmod</span> </td> <td style="text-align:left;"> <span style=" color: black !important;padding-right: 4px; padding-left: 4px; background-color: yellow !important;text-align: c;">lowmod</span> </td> <td style="text-align:left;"> <span style=" color: black !important;padding-right: 4px; padding-left: 4px; background-color: lightgreen !important;text-align: c;">lowest</span> </td> <td style="text-align:left;"> <span style=" color: black !important;padding-right: 4px; padding-left: 4px; background-color: lightgreen !important;text-align: c;">lowest</span> </td> <td style="text-align:left;"> <span style=" color: black !important;padding-right: 4px; padding-left: 4px; background-color: lightgreen !important;text-align: c;">lowest</span> </td> <td style="text-align:left;"> <span style=" color: black !important;padding-right: 4px; padding-left: 4px; background-color: lightgreen !important;text-align: c;">lowest</span> </td> <td style="text-align:left;"> <span style=" color: black !important;padding-right: 4px; padding-left: 4px; background-color: orange !important;text-align: c;">modhigh</span> </td> <td style="text-align:left;"> <span style=" color: black !important;padding-right: 4px; padding-left: 4px; background-color: lightgreen !important;text-align: c;">lowest</span> </td> </tr> <tr> <td style="text-align:left;"> Unmanaged forage </td> <td style="text-align:left;"> <span style=" color: black !important;padding-right: 4px; padding-left: 4px; background-color: white !important;text-align: c;">na</span> </td> <td style="text-align:left;"> <span style=" color: black !important;padding-right: 4px; padding-left: 4px; background-color: white !important;text-align: c;">na</span> </td> <td style="text-align:left;"> <span style=" color: black !important;padding-right: 4px; padding-left: 4px; background-color: white !important;text-align: c;">na</span> </td> <td style="text-align:left;"> <span style=" color: black !important;padding-right: 4px; padding-left: 4px; background-color: lightgreen !important;text-align: c;">lowest</span> </td> <td style="text-align:left;"> <span style=" color: black !important;padding-right: 4px; padding-left: 4px; background-color: yellow !important;text-align: c;">lowmod</span> </td> <td style="text-align:left;"> <span style=" color: black !important;padding-right: 4px; padding-left: 4px; background-color: yellow !important;text-align: c;">lowmod</span> </td> <td style="text-align:left;"> <span style=" color: black !important;padding-right: 4px; padding-left: 4px; background-color: white !important;text-align: c;">na</span> </td> <td style="text-align:left;"> <span style=" color: black !important;padding-right: 4px; padding-left: 4px; background-color: white !important;text-align: c;">na</span> </td> <td style="text-align:left;"> <span style=" color: black !important;padding-right: 4px; padding-left: 4px; background-color: white !important;text-align: c;">na</span> </td> </tr> <tr> <td style="text-align:left;"> Deepsea corals </td> <td style="text-align:left;"> <span style=" color: black !important;padding-right: 4px; padding-left: 4px; background-color: white !important;text-align: c;">na</span> </td> <td style="text-align:left;"> <span style=" color: black !important;padding-right: 4px; padding-left: 4px; background-color: white !important;text-align: c;">na</span> </td> <td style="text-align:left;"> <span style=" color: black !important;padding-right: 4px; padding-left: 4px; background-color: white !important;text-align: c;">na</span> </td> <td style="text-align:left;"> <span style=" color: black !important;padding-right: 4px; padding-left: 4px; background-color: lightgreen !important;text-align: c;">lowest</span> </td> <td style="text-align:left;"> <span style=" color: black !important;padding-right: 4px; padding-left: 4px; background-color: lightgreen !important;text-align: c;">lowest</span> </td> <td style="text-align:left;"> <span style=" color: black !important;padding-right: 4px; padding-left: 4px; background-color: lightgreen !important;text-align: c;">lowest</span> </td> <td style="text-align:left;"> <span style=" color: black !important;padding-right: 4px; padding-left: 4px; background-color: white !important;text-align: c;">na</span> </td> <td style="text-align:left;"> <span style=" color: black !important;padding-right: 4px; padding-left: 4px; background-color: white !important;text-align: c;">na</span> </td> <td style="text-align:left;"> <span style=" color: black !important;padding-right: 4px; padding-left: 4px; background-color: white !important;text-align: c;">na</span> </td> </tr> </tbody> </table> *Ecosystem level risk elements* <table class="risktable table" style="font-size: 9px; margin-left: auto; margin-right: auto;"> <thead> <tr> <th style="text-align:left;"> System </th> <th style="text-align:left;"> EcoProd </th> <th style="text-align:left;"> CommRev </th> <th style="text-align:left;"> RecVal </th> <th style="text-align:left;"> FishRes1 </th> <th style="text-align:left;"> FishRes4 </th> <th style="text-align:left;"> FleetDiv </th> <th style="text-align:left;"> Social </th> <th style="text-align:left;"> ComFood </th> <th style="text-align:left;"> RecFood </th> </tr> </thead> <tbody> <tr> <td style="text-align:left;"> Mid-Atlantic </td> <td style="text-align:left;"> <span style=" color: black !important;padding-right: 4px; padding-left: 4px; background-color: yellow !important;text-align: c;">lowmod</span> </td> <td style="text-align:left;"> <span style=" color: black !important;padding-right: 4px; padding-left: 4px; background-color: orange !important;text-align: c;">modhigh</span> </td> <td style="text-align:left;"> <span style=" color: white !important;padding-right: 4px; padding-left: 4px; background-color: red !important;text-align: c;">highest</span> </td> <td style="text-align:left;"> <span style=" color: black !important;padding-right: 4px; padding-left: 4px; background-color: lightgreen !important;text-align: c;">lowest</span> </td> <td style="text-align:left;"> <span style=" color: black !important;padding-right: 4px; padding-left: 4px; background-color: orange !important;text-align: c;">modhigh</span> </td> <td style="text-align:left;"> <span style=" color: black !important;padding-right: 4px; padding-left: 4px; background-color: lightgreen !important;text-align: c;">lowest</span> </td> <td style="text-align:left;"> <span style=" color: black !important;padding-right: 4px; padding-left: 4px; background-color: yellow !important;text-align: c;">lowmod</span> </td> <td style="text-align:left;"> <span style=" color: white !important;padding-right: 4px; padding-left: 4px; background-color: red !important;text-align: c;">highest</span> </td> <td style="text-align:left;"> <span style=" color: black !important;padding-right: 4px; padding-left: 4px; background-color: orange !important;text-align: c;">modhigh</span> </td> </tr> </tbody> </table> ] .pull-right[ *Species and Sector level risk elements* <table class="risktable table" style="font-size: 11px; margin-left: auto; margin-right: auto;"> <thead> <tr> <th style="text-align:left;"> Species </th> <th style="text-align:left;"> MgtControl </th> <th style="text-align:left;"> TecInteract </th> <th style="text-align:left;"> OceanUse </th> <th style="text-align:left;"> RegComplex </th> <th style="text-align:left;"> Discards </th> <th style="text-align:left;"> Allocation </th> </tr> </thead> <tbody> <tr> <td style="text-align:left;"> Ocean Quahog-C </td> <td style="text-align:left;"> <span style=" color: black !important;padding-right: 4px; padding-left: 4px; background-color: lightgreen !important;text-align: c;">lowest</span> </td> <td style="text-align:left;"> <span style=" color: black !important;padding-right: 4px; padding-left: 4px; background-color: lightgreen !important;text-align: c;">lowest</span> </td> <td style="text-align:left;"> <span style=" color: black !important;padding-right: 4px; padding-left: 4px; background-color: yellow !important;text-align: c;">lowmod</span> </td> <td style="text-align:left;"> <span style=" color: black !important;padding-right: 4px; padding-left: 4px; background-color: lightgreen !important;text-align: c;">lowest</span> </td> <td style="text-align:left;"> <span style=" color: black !important;padding-right: 4px; padding-left: 4px; background-color: orange !important;text-align: c;">modhigh</span> </td> <td style="text-align:left;"> <span style=" color: black !important;padding-right: 4px; padding-left: 4px; background-color: lightgreen !important;text-align: c;">lowest</span> </td> </tr> <tr> <td style="text-align:left;"> Surfclam-C </td> <td style="text-align:left;"> <span style=" color: black !important;padding-right: 4px; padding-left: 4px; background-color: lightgreen !important;text-align: c;">lowest</span> </td> <td style="text-align:left;"> <span style=" color: black !important;padding-right: 4px; padding-left: 4px; background-color: lightgreen !important;text-align: c;">lowest</span> </td> <td style="text-align:left;"> <span style=" color: black !important;padding-right: 4px; padding-left: 4px; background-color: yellow !important;text-align: c;">lowmod</span> </td> <td style="text-align:left;"> <span style=" color: black !important;padding-right: 4px; padding-left: 4px; background-color: lightgreen !important;text-align: c;">lowest</span> </td> <td style="text-align:left;"> <span style=" color: black !important;padding-right: 4px; padding-left: 4px; background-color: orange !important;text-align: c;">modhigh</span> </td> <td style="text-align:left;"> <span style=" color: black !important;padding-right: 4px; padding-left: 4px; background-color: lightgreen !important;text-align: c;">lowest</span> </td> </tr> <tr> <td style="text-align:left;"> Summer flounder-R </td> <td style="text-align:left;"> <span style=" color: black !important;padding-right: 4px; padding-left: 4px; background-color: orange !important;text-align: c;">modhigh</span> </td> <td style="text-align:left;"> <span style=" color: black !important;padding-right: 4px; padding-left: 4px; background-color: lightgreen !important;text-align: c;">lowest</span> </td> <td style="text-align:left;"> <span style=" color: black !important;padding-right: 4px; padding-left: 4px; background-color: yellow !important;text-align: c;">lowmod</span> </td> <td style="text-align:left;"> <span style=" color: black !important;padding-right: 4px; padding-left: 4px; background-color: orange !important;text-align: c;">modhigh</span> </td> <td style="text-align:left;"> <span style=" color: white !important;padding-right: 4px; padding-left: 4px; background-color: red !important;text-align: c;">highest</span> </td> <td style="text-align:left;"> <span style=" color: white !important;padding-right: 4px; padding-left: 4px; background-color: red !important;text-align: c;">highest</span> </td> </tr> <tr> <td style="text-align:left;"> Summer flounder-C </td> <td style="text-align:left;"> <span style=" color: black !important;padding-right: 4px; padding-left: 4px; background-color: yellow !important;text-align: c;">lowmod</span> </td> <td style="text-align:left;"> <span style=" color: black !important;padding-right: 4px; padding-left: 4px; background-color: orange !important;text-align: c;">modhigh</span> </td> <td style="text-align:left;"> <span style=" color: black !important;padding-right: 4px; padding-left: 4px; background-color: yellow !important;text-align: c;">lowmod</span> </td> <td style="text-align:left;"> <span style=" color: black !important;padding-right: 4px; padding-left: 4px; background-color: orange !important;text-align: c;">modhigh</span> </td> <td style="text-align:left;"> <span style=" color: black !important;padding-right: 4px; padding-left: 4px; background-color: orange !important;text-align: c;">modhigh</span> </td> <td style="text-align:left;"> <span style=" color: white !important;padding-right: 4px; padding-left: 4px; background-color: red !important;text-align: c;">highest</span> </td> </tr> <tr> <td style="text-align:left;"> Scup-R </td> <td style="text-align:left;"> <span style=" color: black !important;padding-right: 4px; padding-left: 4px; background-color: yellow !important;text-align: c;">lowmod</span> </td> <td style="text-align:left;"> <span style=" color: black !important;padding-right: 4px; padding-left: 4px; background-color: lightgreen !important;text-align: c;">lowest</span> </td> <td style="text-align:left;"> <span style=" color: black !important;padding-right: 4px; padding-left: 4px; background-color: yellow !important;text-align: c;">lowmod</span> </td> <td style="text-align:left;"> <span style=" color: black !important;padding-right: 4px; padding-left: 4px; background-color: orange !important;text-align: c;">modhigh</span> </td> <td style="text-align:left;"> <span style=" color: black !important;padding-right: 4px; padding-left: 4px; background-color: orange !important;text-align: c;">modhigh</span> </td> <td style="text-align:left;"> <span style=" color: white !important;padding-right: 4px; padding-left: 4px; background-color: red !important;text-align: c;">highest</span> </td> </tr> <tr> <td style="text-align:left;"> Scup-C </td> <td style="text-align:left;"> <span style=" color: black !important;padding-right: 4px; padding-left: 4px; background-color: lightgreen !important;text-align: c;">lowest</span> </td> <td style="text-align:left;"> <span style=" color: black !important;padding-right: 4px; padding-left: 4px; background-color: yellow !important;text-align: c;">lowmod</span> </td> <td style="text-align:left;"> <span style=" color: black !important;padding-right: 4px; padding-left: 4px; background-color: orange !important;text-align: c;">modhigh</span> </td> <td style="text-align:left;"> <span style=" color: black !important;padding-right: 4px; padding-left: 4px; background-color: orange !important;text-align: c;">modhigh</span> </td> <td style="text-align:left;"> <span style=" color: black !important;padding-right: 4px; padding-left: 4px; background-color: orange !important;text-align: c;">modhigh</span> </td> <td style="text-align:left;"> <span style=" color: white !important;padding-right: 4px; padding-left: 4px; background-color: red !important;text-align: c;">highest</span> </td> </tr> <tr> <td style="text-align:left;"> Black sea bass-R </td> <td style="text-align:left;"> <span style=" color: white !important;padding-right: 4px; padding-left: 4px; background-color: red !important;text-align: c;">highest</span> </td> <td style="text-align:left;"> <span style=" color: black !important;padding-right: 4px; padding-left: 4px; background-color: lightgreen !important;text-align: c;">lowest</span> </td> <td style="text-align:left;"> <span style=" color: black !important;padding-right: 4px; padding-left: 4px; background-color: orange !important;text-align: c;">modhigh</span> </td> <td style="text-align:left;"> <span style=" color: black !important;padding-right: 4px; padding-left: 4px; background-color: orange !important;text-align: c;">modhigh</span> </td> <td style="text-align:left;"> <span style=" color: white !important;padding-right: 4px; padding-left: 4px; background-color: red !important;text-align: c;">highest</span> </td> <td style="text-align:left;"> <span style=" color: white !important;padding-right: 4px; padding-left: 4px; background-color: red !important;text-align: c;">highest</span> </td> </tr> <tr> <td style="text-align:left;"> Black sea bass-C </td> <td style="text-align:left;"> <span style=" color: white !important;padding-right: 4px; padding-left: 4px; background-color: red !important;text-align: c;">highest</span> </td> <td style="text-align:left;"> <span style=" color: black !important;padding-right: 4px; padding-left: 4px; background-color: yellow !important;text-align: c;">lowmod</span> </td> <td style="text-align:left;"> <span style=" color: white !important;padding-right: 4px; padding-left: 4px; background-color: red !important;text-align: c;">highest</span> </td> <td style="text-align:left;"> <span style=" color: black !important;padding-right: 4px; padding-left: 4px; background-color: orange !important;text-align: c;">modhigh</span> </td> <td style="text-align:left;"> <span style=" color: white !important;padding-right: 4px; padding-left: 4px; background-color: red !important;text-align: c;">highest</span> </td> <td style="text-align:left;"> <span style=" color: white !important;padding-right: 4px; padding-left: 4px; background-color: red !important;text-align: c;">highest</span> </td> </tr> <tr> <td style="text-align:left;"> Atl. mackerel-R </td> <td style="text-align:left;"> <span style=" color: black !important;padding-right: 4px; padding-left: 4px; background-color: yellow !important;text-align: c;">lowmod</span> </td> <td style="text-align:left;"> <span style=" color: black !important;padding-right: 4px; padding-left: 4px; background-color: lightgreen !important;text-align: c;">lowest</span> </td> <td style="text-align:left;"> <span style=" color: black !important;padding-right: 4px; padding-left: 4px; background-color: lightgreen !important;text-align: c;">lowest</span> </td> <td style="text-align:left;"> <span style=" color: black !important;padding-right: 4px; padding-left: 4px; background-color: lightgreen !important;text-align: c;">lowest</span> </td> <td style="text-align:left;"> <span style=" color: black !important;padding-right: 4px; padding-left: 4px; background-color: lightgreen !important;text-align: c;">lowest</span> </td> <td style="text-align:left;"> <span style=" color: black !important;padding-right: 4px; padding-left: 4px; background-color: lightgreen !important;text-align: c;">lowest</span> </td> </tr> <tr> <td style="text-align:left;"> Atl. mackerel-C </td> <td style="text-align:left;"> <span style=" color: black !important;padding-right: 4px; padding-left: 4px; background-color: lightgreen !important;text-align: c;">lowest</span> </td> <td style="text-align:left;"> <span style=" color: black !important;padding-right: 4px; padding-left: 4px; background-color: yellow !important;text-align: c;">lowmod</span> </td> <td style="text-align:left;"> <span style=" color: black !important;padding-right: 4px; padding-left: 4px; background-color: orange !important;text-align: c;">modhigh</span> </td> <td style="text-align:left;"> <span style=" color: white !important;padding-right: 4px; padding-left: 4px; background-color: red !important;text-align: c;">highest</span> </td> <td style="text-align:left;"> <span style=" color: black !important;padding-right: 4px; padding-left: 4px; background-color: yellow !important;text-align: c;">lowmod</span> </td> <td style="text-align:left;"> <span style=" color: white !important;padding-right: 4px; padding-left: 4px; background-color: red !important;text-align: c;">highest</span> </td> </tr> <tr> <td style="text-align:left;"> Butterfish-C </td> <td style="text-align:left;"> <span style=" color: black !important;padding-right: 4px; padding-left: 4px; background-color: lightgreen !important;text-align: c;">lowest</span> </td> <td style="text-align:left;"> <span style=" color: black !important;padding-right: 4px; padding-left: 4px; background-color: yellow !important;text-align: c;">lowmod</span> </td> <td style="text-align:left;"> <span style=" color: black !important;padding-right: 4px; padding-left: 4px; background-color: orange !important;text-align: c;">modhigh</span> </td> <td style="text-align:left;"> <span style=" color: white !important;padding-right: 4px; padding-left: 4px; background-color: red !important;text-align: c;">highest</span> </td> <td style="text-align:left;"> <span style=" color: black !important;padding-right: 4px; padding-left: 4px; background-color: orange !important;text-align: c;">modhigh</span> </td> <td style="text-align:left;"> <span style=" color: black !important;padding-right: 4px; padding-left: 4px; background-color: lightgreen !important;text-align: c;">lowest</span> </td> </tr> <tr> <td style="text-align:left;"> Longfin squid-C </td> <td style="text-align:left;"> <span style=" color: black !important;padding-right: 4px; padding-left: 4px; background-color: lightgreen !important;text-align: c;">lowest</span> </td> <td style="text-align:left;"> <span style=" color: black !important;padding-right: 4px; padding-left: 4px; background-color: orange !important;text-align: c;">modhigh</span> </td> <td style="text-align:left;"> <span style=" color: white !important;padding-right: 4px; padding-left: 4px; background-color: red !important;text-align: c;">highest</span> </td> <td style="text-align:left;"> <span style=" color: white !important;padding-right: 4px; padding-left: 4px; background-color: red !important;text-align: c;">highest</span> </td> <td style="text-align:left;"> <span style=" color: white !important;padding-right: 4px; padding-left: 4px; background-color: red !important;text-align: c;">highest</span> </td> <td style="text-align:left;"> <span style=" color: black !important;padding-right: 4px; padding-left: 4px; background-color: lightgreen !important;text-align: c;">lowest</span> </td> </tr> <tr> <td style="text-align:left;"> Shortfin squid-C </td> <td style="text-align:left;"> <span style=" color: black !important;padding-right: 4px; padding-left: 4px; background-color: yellow !important;text-align: c;">lowmod</span> </td> <td style="text-align:left;"> <span style=" color: black !important;padding-right: 4px; padding-left: 4px; background-color: yellow !important;text-align: c;">lowmod</span> </td> <td style="text-align:left;"> <span style=" color: black !important;padding-right: 4px; padding-left: 4px; background-color: yellow !important;text-align: c;">lowmod</span> </td> <td style="text-align:left;"> <span style=" color: black !important;padding-right: 4px; padding-left: 4px; background-color: yellow !important;text-align: c;">lowmod</span> </td> <td style="text-align:left;"> <span style=" color: black !important;padding-right: 4px; padding-left: 4px; background-color: lightgreen !important;text-align: c;">lowest</span> </td> <td style="text-align:left;"> <span style=" color: black !important;padding-right: 4px; padding-left: 4px; background-color: lightgreen !important;text-align: c;">lowest</span> </td> </tr> <tr> <td style="text-align:left;"> Golden tilefish-R </td> <td style="text-align:left;"> <span style=" color: black !important;padding-right: 4px; padding-left: 4px; background-color: white !important;text-align: c;">na</span> </td> <td style="text-align:left;"> <span style=" color: black !important;padding-right: 4px; padding-left: 4px; background-color: lightgreen !important;text-align: c;">lowest</span> </td> <td style="text-align:left;"> <span style=" color: black !important;padding-right: 4px; padding-left: 4px; background-color: lightgreen !important;text-align: c;">lowest</span> </td> <td style="text-align:left;"> <span style=" color: black !important;padding-right: 4px; padding-left: 4px; background-color: lightgreen !important;text-align: c;">lowest</span> </td> <td style="text-align:left;"> <span style=" color: black !important;padding-right: 4px; padding-left: 4px; background-color: lightgreen !important;text-align: c;">lowest</span> </td> <td style="text-align:left;"> <span style=" color: black !important;padding-right: 4px; padding-left: 4px; background-color: lightgreen !important;text-align: c;">lowest</span> </td> </tr> <tr> <td style="text-align:left;"> Golden tilefish-C </td> <td style="text-align:left;"> <span style=" color: black !important;padding-right: 4px; padding-left: 4px; background-color: lightgreen !important;text-align: c;">lowest</span> </td> <td style="text-align:left;"> <span style=" color: black !important;padding-right: 4px; padding-left: 4px; background-color: lightgreen !important;text-align: c;">lowest</span> </td> <td style="text-align:left;"> <span style=" color: black !important;padding-right: 4px; padding-left: 4px; background-color: lightgreen !important;text-align: c;">lowest</span> </td> <td style="text-align:left;"> <span style=" color: black !important;padding-right: 4px; padding-left: 4px; background-color: lightgreen !important;text-align: c;">lowest</span> </td> <td style="text-align:left;"> <span style=" color: black !important;padding-right: 4px; padding-left: 4px; background-color: lightgreen !important;text-align: c;">lowest</span> </td> <td style="text-align:left;"> <span style=" color: black !important;padding-right: 4px; padding-left: 4px; background-color: lightgreen !important;text-align: c;">lowest</span> </td> </tr> <tr> <td style="text-align:left;"> Blueline tilefish-R </td> <td style="text-align:left;"> <span style=" color: black !important;padding-right: 4px; padding-left: 4px; background-color: lightgreen !important;text-align: c;">lowest</span> </td> <td style="text-align:left;"> <span style=" color: black !important;padding-right: 4px; padding-left: 4px; background-color: lightgreen !important;text-align: c;">lowest</span> </td> <td style="text-align:left;"> <span style=" color: black !important;padding-right: 4px; padding-left: 4px; background-color: lightgreen !important;text-align: c;">lowest</span> </td> <td style="text-align:left;"> <span style=" color: black !important;padding-right: 4px; padding-left: 4px; background-color: orange !important;text-align: c;">modhigh</span> </td> <td style="text-align:left;"> <span style=" color: black !important;padding-right: 4px; padding-left: 4px; background-color: lightgreen !important;text-align: c;">lowest</span> </td> <td style="text-align:left;"> <span style=" color: white !important;padding-right: 4px; padding-left: 4px; background-color: red !important;text-align: c;">highest</span> </td> </tr> <tr> <td style="text-align:left;"> Blueline tilefish-C </td> <td style="text-align:left;"> <span style=" color: black !important;padding-right: 4px; padding-left: 4px; background-color: lightgreen !important;text-align: c;">lowest</span> </td> <td style="text-align:left;"> <span style=" color: black !important;padding-right: 4px; padding-left: 4px; background-color: lightgreen !important;text-align: c;">lowest</span> </td> <td style="text-align:left;"> <span style=" color: black !important;padding-right: 4px; padding-left: 4px; background-color: lightgreen !important;text-align: c;">lowest</span> </td> <td style="text-align:left;"> <span style=" color: black !important;padding-right: 4px; padding-left: 4px; background-color: orange !important;text-align: c;">modhigh</span> </td> <td style="text-align:left;"> <span style=" color: black !important;padding-right: 4px; padding-left: 4px; background-color: lightgreen !important;text-align: c;">lowest</span> </td> <td style="text-align:left;"> <span style=" color: white !important;padding-right: 4px; padding-left: 4px; background-color: red !important;text-align: c;">highest</span> </td> </tr> <tr> <td style="text-align:left;"> Bluefish-R </td> <td style="text-align:left;"> <span style=" color: black !important;padding-right: 4px; padding-left: 4px; background-color: yellow !important;text-align: c;">lowmod</span> </td> <td style="text-align:left;"> <span style=" color: black !important;padding-right: 4px; padding-left: 4px; background-color: lightgreen !important;text-align: c;">lowest</span> </td> <td style="text-align:left;"> <span style=" color: black !important;padding-right: 4px; padding-left: 4px; background-color: lightgreen !important;text-align: c;">lowest</span> </td> <td style="text-align:left;"> <span style=" color: black !important;padding-right: 4px; padding-left: 4px; background-color: yellow !important;text-align: c;">lowmod</span> </td> <td style="text-align:left;"> <span style=" color: black !important;padding-right: 4px; padding-left: 4px; background-color: orange !important;text-align: c;">modhigh</span> </td> <td style="text-align:left;"> <span style=" color: white !important;padding-right: 4px; padding-left: 4px; background-color: red !important;text-align: c;">highest</span> </td> </tr> <tr> <td style="text-align:left;"> Bluefish-C </td> <td style="text-align:left;"> <span style=" color: black !important;padding-right: 4px; padding-left: 4px; background-color: lightgreen !important;text-align: c;">lowest</span> </td> <td style="text-align:left;"> <span style=" color: black !important;padding-right: 4px; padding-left: 4px; background-color: lightgreen !important;text-align: c;">lowest</span> </td> <td style="text-align:left;"> <span style=" color: black !important;padding-right: 4px; padding-left: 4px; background-color: yellow !important;text-align: c;">lowmod</span> </td> <td style="text-align:left;"> <span style=" color: black !important;padding-right: 4px; padding-left: 4px; background-color: yellow !important;text-align: c;">lowmod</span> </td> <td style="text-align:left;"> <span style=" color: black !important;padding-right: 4px; padding-left: 4px; background-color: yellow !important;text-align: c;">lowmod</span> </td> <td style="text-align:left;"> <span style=" color: white !important;padding-right: 4px; padding-left: 4px; background-color: red !important;text-align: c;">highest</span> </td> </tr> <tr> <td style="text-align:left;"> Spiny dogfish-R </td> <td style="text-align:left;"> <span style=" color: black !important;padding-right: 4px; padding-left: 4px; background-color: lightgreen !important;text-align: c;">lowest</span> </td> <td style="text-align:left;"> <span style=" color: black !important;padding-right: 4px; padding-left: 4px; background-color: lightgreen !important;text-align: c;">lowest</span> </td> <td style="text-align:left;"> <span style=" color: black !important;padding-right: 4px; padding-left: 4px; background-color: lightgreen !important;text-align: c;">lowest</span> </td> <td style="text-align:left;"> <span style=" color: black !important;padding-right: 4px; padding-left: 4px; background-color: lightgreen !important;text-align: c;">lowest</span> </td> <td style="text-align:left;"> <span style=" color: black !important;padding-right: 4px; padding-left: 4px; background-color: lightgreen !important;text-align: c;">lowest</span> </td> <td style="text-align:left;"> <span style=" color: black !important;padding-right: 4px; padding-left: 4px; background-color: lightgreen !important;text-align: c;">lowest</span> </td> </tr> <tr> <td style="text-align:left;"> Spiny dogfish-C </td> <td style="text-align:left;"> <span style=" color: black !important;padding-right: 4px; padding-left: 4px; background-color: lightgreen !important;text-align: c;">lowest</span> </td> <td style="text-align:left;"> <span style=" color: black !important;padding-right: 4px; padding-left: 4px; background-color: orange !important;text-align: c;">modhigh</span> </td> <td style="text-align:left;"> <span style=" color: black !important;padding-right: 4px; padding-left: 4px; background-color: orange !important;text-align: c;">modhigh</span> </td> <td style="text-align:left;"> <span style=" color: black !important;padding-right: 4px; padding-left: 4px; background-color: orange !important;text-align: c;">modhigh</span> </td> <td style="text-align:left;"> <span style=" color: black !important;padding-right: 4px; padding-left: 4px; background-color: yellow !important;text-align: c;">lowmod</span> </td> <td style="text-align:left;"> <span style=" color: black !important;padding-right: 4px; padding-left: 4px; background-color: lightgreen !important;text-align: c;">lowest</span> </td> </tr> <tr> <td style="text-align:left;"> Chub mackerel-C </td> <td style="text-align:left;"> <span style=" color: black !important;padding-right: 4px; padding-left: 4px; background-color: lightgreen !important;text-align: c;">lowest</span> </td> <td style="text-align:left;"> <span style=" color: black !important;padding-right: 4px; padding-left: 4px; background-color: yellow !important;text-align: c;">lowmod</span> </td> <td style="text-align:left;"> <span style=" color: black !important;padding-right: 4px; padding-left: 4px; background-color: yellow !important;text-align: c;">lowmod</span> </td> <td style="text-align:left;"> <span style=" color: black !important;padding-right: 4px; padding-left: 4px; background-color: yellow !important;text-align: c;">lowmod</span> </td> <td style="text-align:left;"> <span style=" color: black !important;padding-right: 4px; padding-left: 4px; background-color: lightgreen !important;text-align: c;">lowest</span> </td> <td style="text-align:left;"> <span style=" color: black !important;padding-right: 4px; padding-left: 4px; background-color: lightgreen !important;text-align: c;">lowest</span> </td> </tr> <tr> <td style="text-align:left;"> Unmanaged forage </td> <td style="text-align:left;"> <span style=" color: black !important;padding-right: 4px; padding-left: 4px; background-color: lightgreen !important;text-align: c;">lowest</span> </td> <td style="text-align:left;"> <span style=" color: black !important;padding-right: 4px; padding-left: 4px; background-color: lightgreen !important;text-align: c;">lowest</span> </td> <td style="text-align:left;"> <span style=" color: black !important;padding-right: 4px; padding-left: 4px; background-color: orange !important;text-align: c;">modhigh</span> </td> <td style="text-align:left;"> <span style=" color: black !important;padding-right: 4px; padding-left: 4px; background-color: lightgreen !important;text-align: c;">lowest</span> </td> <td style="text-align:left;"> <span style=" color: black !important;padding-right: 4px; padding-left: 4px; background-color: lightgreen !important;text-align: c;">lowest</span> </td> <td style="text-align:left;"> <span style=" color: black !important;padding-right: 4px; padding-left: 4px; background-color: lightgreen !important;text-align: c;">lowest</span> </td> </tr> <tr> <td style="text-align:left;"> Deepsea corals </td> <td style="text-align:left;"> <span style=" color: black !important;padding-right: 4px; padding-left: 4px; background-color: white !important;text-align: c;">na</span> </td> <td style="text-align:left;"> <span style=" color: black !important;padding-right: 4px; padding-left: 4px; background-color: white !important;text-align: c;">na</span> </td> <td style="text-align:left;"> <span style=" color: black !important;padding-right: 4px; padding-left: 4px; background-color: orange !important;text-align: c;">modhigh</span> </td> <td style="text-align:left;"> <span style=" color: black !important;padding-right: 4px; padding-left: 4px; background-color: white !important;text-align: c;">na</span> </td> <td style="text-align:left;"> <span style=" color: black !important;padding-right: 4px; padding-left: 4px; background-color: white !important;text-align: c;">na</span> </td> <td style="text-align:left;"> <span style=" color: black !important;padding-right: 4px; padding-left: 4px; background-color: white !important;text-align: c;">na</span> </td> </tr> </tbody> </table> ] ??? Changes: Butterfish B status risk increased from lowest to low-mod (below Bmsy) Allocation risk decreased for 4 fisheries from high to low (intermediate rankings not applied) Black sea bass regulatory complexity risk decreased from highest to moderate-high Potential new indicators from new SOE sections on climate risk, habitat vulnerability, offshore wind --- ## How is MAFMC using the risk assessment? What's next? .pull-left[ * Based on risk assessment, the Council selected summer flounder as high-risk fishery for conceptual modeling  ] .pull-right[ * Working group of habitat, biology, stock assessment, management, economic and social scientists developed: * draft conceptual models of high risk elements, linkages * dataset identification and gap analysis for each element and link * draft questions that the Council could persue with additional work * Final conceptual model (next slide) and supporting information at December 2019 Council meeting ] *Council proceeding with management strategy evaluation (MSE) using the information from conceptual modeling as a basis. Topic: addressing recreational fishery discards with EAFM* --- <div id="htmlwidget-8c8ddd46fe225402ca56" style="width:100%;height:710px;" class="widgetframe html-widget"></div> <script type="application/json" data-for="htmlwidget-8c8ddd46fe225402ca56">{"x":{"url":"20210329_MAFMC_MSEwkshp_EAFM_Intro_Gaichas_files/figure-html//widgets/widget_sfconceptmod.html","options":{"xdomain":"*","allowfullscreen":false,"lazyload":false}},"evals":[],"jsHooks":[]}</script> ??? In this interactive circular graph visualization, model elements identified as important by the Council (through risk assessment) and by the working group (through a range of experience and expertise) are at the perimeter of the circle. Elements are defined in detail in the last section of [this page](https://gdepiper.github.io/Summer_Flounder_Conceptual_Models/sfconsmod_riskfactors_subplots.html). Relationships between elements are represented as links across the center of the circle to other elements on the perimeter. Links from a model element that affect another element start wide at the base and are color coded to match the category of the element they affect.Hover over a perimeter section (an element) to see all relationships for that element, including links from other elements. Hover over a link to see what it connects. Links by default show text for the two elements and the direction of the relationship (1 for relationship, 0 for no relationship--most links are one direction).For example, hovering over the element "Total Landings" in the full model shows that the working group identified the elements affected by landings as Seafood Production, Recreational Value, and Commercial Profits (three links leading out from landings), and the elements affecting landings as Fluke SSB, Fluke Distributional Shift, Risk Buffering, Management Control, Total Discards, and Shoreside Support (6 links leading into Total Landings). --- ## Council-selected management question: ##Evaluate the biological and economic benefits of minimizing summer flounder discards and converting discards into landings in the recreational sector. Identify management strategies to effectively realize these benefits. .pull-left[ * Opportunity to align EAFM work with traditional Council process * Management challenges to address and reduce regulatory discards + 90% of rec summer flounder catch is released * Raised by AP members and stakeholders seeking management to address * EAFM issue and focus – seven linked categories: Management, Summer Flounder Stock, Science, Fishing Fleets, and Benefits  ] .pull-right[ 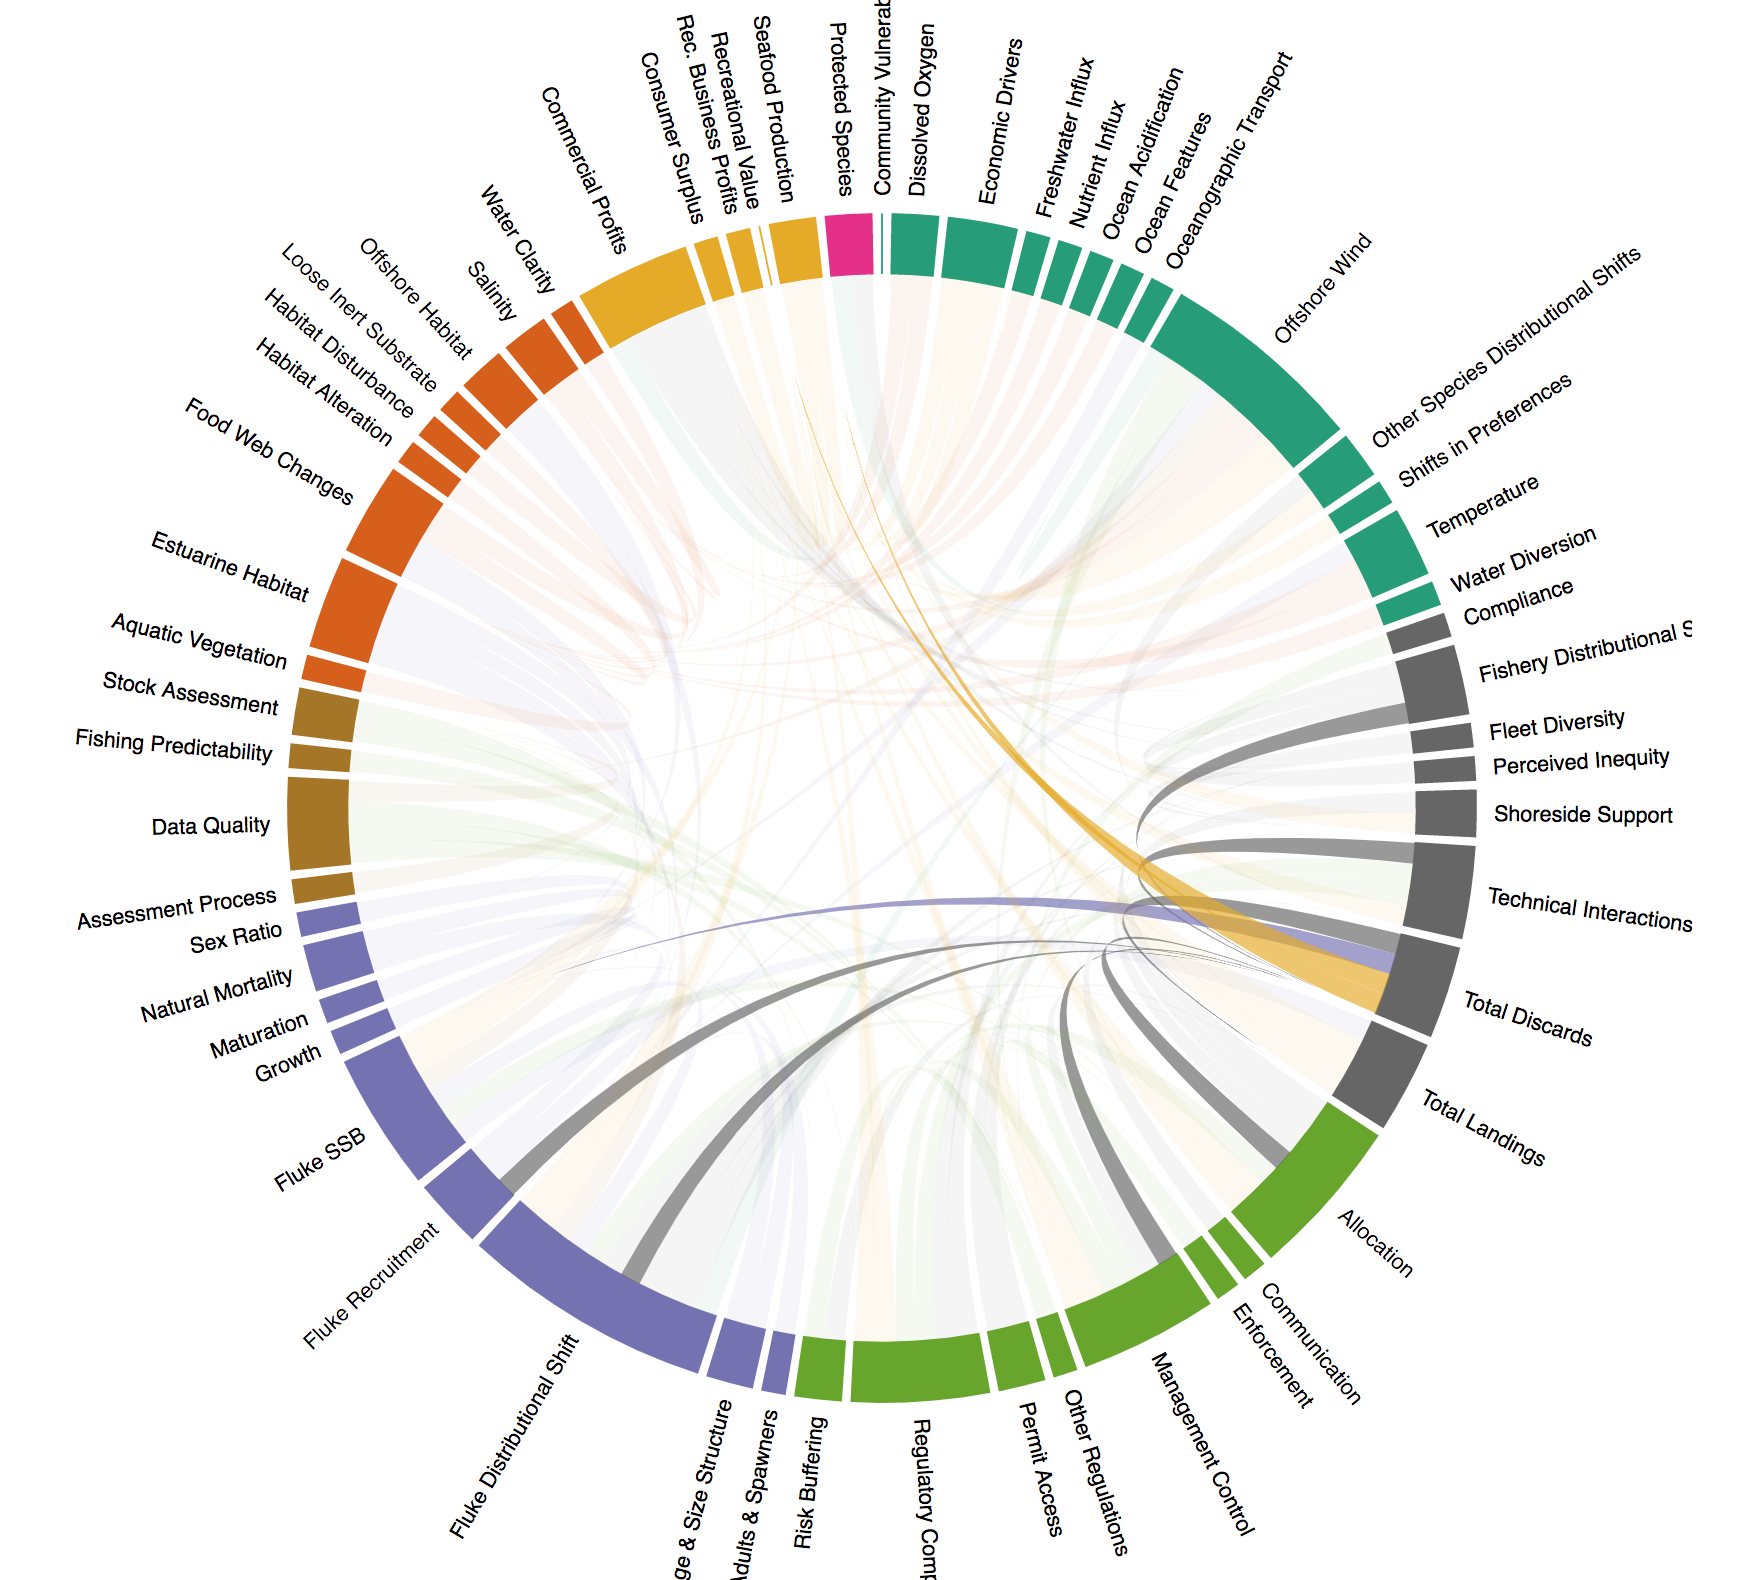 ] --- # Now: management strategy evaluation .pull-left-40[ * You are here! * Opportunity to participate and shape the analysis * Iterative process with feedback * Introduction to MSE process up next ] .pull-right-60[  ] --- ## Details .pull-left[ * [Mid-Atlantic Council EAFM paper, 2016](https://www.frontiersin.org/articles/10.3389/fmars.2016.00105/full) * [Mid-Atlantic Council Risk Assessment paper, 2018](https://www.frontiersin.org/articles/10.3389/fmars.2018.00442/full#h11) * [Mid-Atlantic Council Summer Flounder conceptual model, support tables, 2019](https://gdepiper.github.io/Summer_Flounder_Conceptual_Models/sfconsmod_riskfactors_subplots.html) * [Management questions and conceptual model, 2019](https://gdepiper.github.io/Summer_Flounder_Conceptual_Models/sfconsmod_final_2col.html) ] .pull-right[ * [Mid-Atlantic Council EAFM paper, 2021](https://www.tandfonline.com/doi/full/10.1080/08920753.2021.1846156) * [Mid-Atantic April 2021 EAFM updates, including MSE](https://www.mafmc.org/s/Tab01_EAFM-Updates_2021-04.pdf) * [Mid-Atlantic April 2021 State of the Ecosystem report](https://www.mafmc.org/s/Tab06_SOE-Mid-Atlantic-Risk-Assessment__2021-04.pdf) ] .center[ # Questions? Thank you! ] .footnote[ Slides available at https://noaa-edab.github.io/presentations Contact <Sarah.Gaichas@noaa.gov> ]