class: right, middle, my-title, title-slide # State of the Ecosystem Structure<br /> Proposed 2021 ## SOE January Synthesis Meeting<br /> 19 January 2021 ### Sarah Gaichas and Sean Lucey<br /> Northeast Fisheries Science Center<br /> <br /> Many thanks to:<br /> Kimberly Bastille, Geret DePiper, Kimberly Hyde, Scott Large,<br /> and all SOE contributors --- class: top, left # State of the Ecosystem (SOE) reporting ## Improving ecosystem information and synthesis for fishery managers .pull-left[ - Ecosystem indicators linked to management objectives <a name=cite-depiper_operationalizing_2017></a>([DePiper, et al., 2017](https://academic.oup.com/icesjms/article/74/8/2076/3094701)) + Contextual information + Report evolving since 2016 + Fishery-relevant subset of full Ecosystem Status Reprorts - Open science emphasis <a name=cite-bastille_improving_2020></a>([Bastille, et al., 2020](https://doi.org/10.1080/08920753.2021.1846155)) - Used within Mid-Atlantic Fishery Management Council's Ecosystem Process <a name=cite-muffley_there_2020></a>([Muffley, et al., 2020](https://doi.org/10.1080/08920753.2021.1846156)) ] .pull-right[ *The IEA Loop<sup>1</sup>* 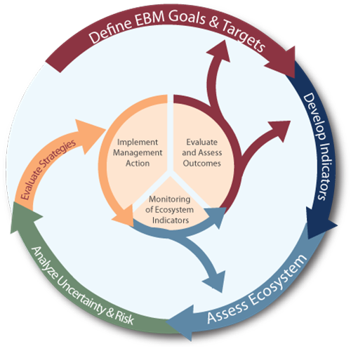 .footnote[ [1] https://www.integratedecosystemassessment.noaa.gov/national/IEA-approach ] ] ??? --- ## State of the Ecosystem: Structure .pull-left[ ## 2020 Report 1. Summary 2 pager 1. Human dimensions 1. Protected species 1. Fish and invertebrates (managed and otherwise) 1. Habitat quality and ecosystem productivity ## 2021 Proposed 1. Summary 2 pager + Page 1 summary bullets + Page 2 synthesis themes 1. Performance against management objectives 1. Risks ] .pull-right[ *Established ecosystem-scale objectives* <table class="table" style="font-size: 14px; margin-left: auto; margin-right: auto;"> <thead> <tr> <th style="text-align:left;font-weight: bold;"> Objective Categories </th> <th style="text-align:left;font-weight: bold;"> Indicators reported here </th> </tr> </thead> <tbody> <tr grouplength="4"><td colspan="2" style="border-bottom: 1px solid;"><strong>Provisioning/Cultural</strong></td></tr> <tr> <td style="text-align:left; padding-left: 2em;" indentlevel="1"> Seafood Production </td> <td style="text-align:left;"> Landings by feeding guild </td> </tr> <tr> <td style="text-align:left; padding-left: 2em;" indentlevel="1"> Profits </td> <td style="text-align:left;"> Revenue decomposed to price and volume </td> </tr> <tr> <td style="text-align:left; padding-left: 2em;" indentlevel="1"> Recreation </td> <td style="text-align:left;"> Days fished; recreational catch </td> </tr> <tr> <td style="text-align:left; padding-left: 2em;" indentlevel="1"> Social & Cultural </td> <td style="text-align:left;"> Commercial engagement trends </td> </tr> <tr grouplength="5"><td colspan="2" style="border-bottom: 1px solid;"><strong>Supporting/Regulating</strong></td></tr> <tr> <td style="text-align:left; padding-left: 2em;" indentlevel="1"> Stability </td> <td style="text-align:left;"> Diversity indices (fishery and species) </td> </tr> <tr> <td style="text-align:left; padding-left: 2em;" indentlevel="1"> Biomass </td> <td style="text-align:left;"> Biomass or abundance by feeding guild from surveys </td> </tr> <tr> <td style="text-align:left; padding-left: 2em;" indentlevel="1"> Productivity </td> <td style="text-align:left;"> Condition and recruitment of managed species, Primary productivity </td> </tr> <tr> <td style="text-align:left; padding-left: 2em;" indentlevel="1"> Trophic structure </td> <td style="text-align:left;"> Relative biomass of feeding guilds, Zooplankton </td> </tr> <tr> <td style="text-align:left; padding-left: 2em;" indentlevel="1"> Habitat </td> <td style="text-align:left;"> Estuarine and offshore habitat conditions </td> </tr> </tbody> </table> ] --- ## [2020 Report](https://doi.org/10.25923/1f8j-d564): Summary 2 pager with visualizations, 28 pages of narrative/plots, 1 page orientation .pull-left[ .center[ 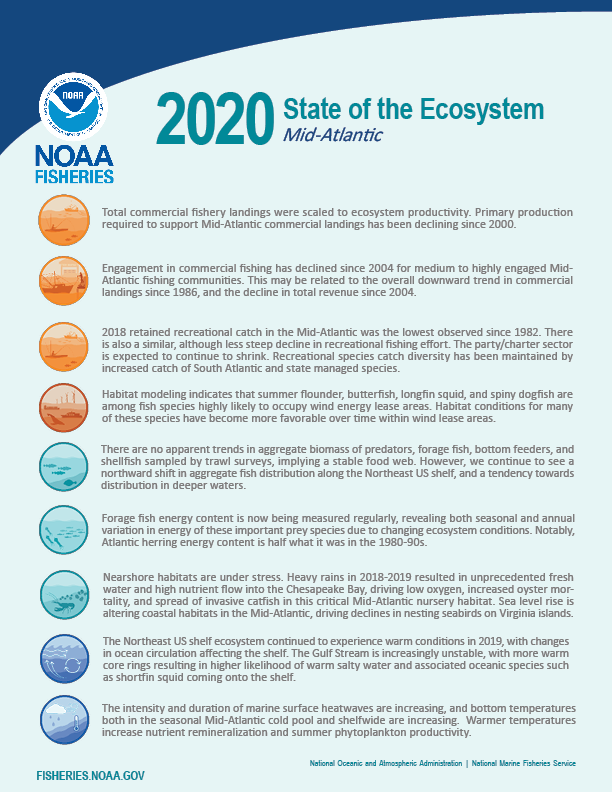 ] ] .pull-right[ .center[ 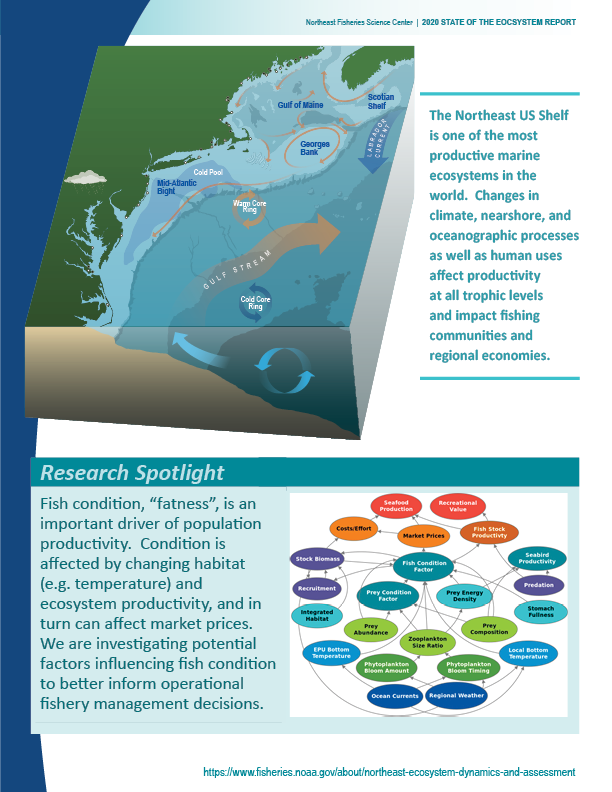 ] ] --- ## 2020 Request tracking memo <table class="table" style="font-size: 9px; margin-left: auto; margin-right: auto;"> <thead> <tr> <th style="text-align:left;font-weight: bold;"> Request </th> <th style="text-align:right;font-weight: bold;"> Year </th> <th style="text-align:left;font-weight: bold;"> Source </th> <th style="text-align:left;font-weight: bold;"> Progress </th> <th style="text-align:left;font-weight: bold;"> Memo Section </th> </tr> </thead> <tbody> <tr> <td style="text-align:left;width: 8cm; "> Ecosystem Overfishing indicators (Link and Watson, 2019) </td> <td style="text-align:right;width: 1cm; "> 2020 </td> <td style="text-align:left;width: 2cm; "> Both Councils </td> <td style="text-align:left;width: 10cm; "> SOE total catch/area, total catch/PP, and total catch/Chl -- challenge is for total catch </td> <td style="text-align:left;width: 2cm; "> 1 </td> </tr> <tr> <td style="text-align:left;width: 8cm; "> Primary production required, interpretation of decline? </td> <td style="text-align:right;width: 1cm; "> 2020 </td> <td style="text-align:left;width: 2cm; "> Both Councils </td> <td style="text-align:left;width: 10cm; "> SOE indicator reworked to include some Link and Watson metrics </td> <td style="text-align:left;width: 2cm; "> 2 </td> </tr> <tr> <td style="text-align:left;width: 8cm; "> Climate Change context </td> <td style="text-align:right;width: 1cm; "> 2020 </td> <td style="text-align:left;width: 2cm; "> NEFMC </td> <td style="text-align:left;width: 10cm; "> SOE reorganized; Risks section added emphasizing climate change </td> <td style="text-align:left;width: 2cm; "> 3 </td> </tr> <tr> <td style="text-align:left;width: 8cm; "> Clarify language (e.g., primary production required) </td> <td style="text-align:right;width: 1cm; "> 2020 </td> <td style="text-align:left;width: 2cm; "> Both Councils </td> <td style="text-align:left;width: 10cm; "> RCB help requested </td> <td style="text-align:left;width: 2cm; "> 4 </td> </tr> <tr> <td style="text-align:left;width: 8cm; "> Copy Editing </td> <td style="text-align:right;width: 1cm; "> 2020 </td> <td style="text-align:left;width: 2cm; "> Both Councils </td> <td style="text-align:left;width: 10cm; "> RCB help requested </td> <td style="text-align:left;width: 2cm; "> 5 </td> </tr> <tr> <td style="text-align:left;width: 8cm; "> Ocean Acidification </td> <td style="text-align:right;width: 1cm; "> 2020 </td> <td style="text-align:left;width: 2cm; "> NEFMC </td> <td style="text-align:left;width: 10cm; "> SOE indicator added with in-situ data linked to preliminary lab work on thresholds </td> <td style="text-align:left;width: 2cm; "> 6 </td> </tr> <tr> <td style="text-align:left;width: 8cm; "> Include examples of High/Low engaged ports </td> <td style="text-align:right;width: 1cm; "> 2020 </td> <td style="text-align:left;width: 2cm; "> NEFMC </td> <td style="text-align:left;width: 10cm; "> SOE indicator reworked to show ports </td> <td style="text-align:left;width: 2cm; "> 7 </td> </tr> <tr> <td style="text-align:left;width: 8cm; "> Expand wind lease area and habitat overlap </td> <td style="text-align:right;width: 1cm; "> 2020 </td> <td style="text-align:left;width: 2cm; "> MAFMC </td> <td style="text-align:left;width: 10cm; "> SOE indicator expanded to rank species with habitat in wind lease areas by landings in wind lease areas </td> <td style="text-align:left;width: 2cm; "> 8 </td> </tr> <tr> <td style="text-align:left;width: 8cm; "> Expand cold pool index </td> <td style="text-align:right;width: 1cm; "> 2020 </td> <td style="text-align:left;width: 2cm; "> MAFMC </td> <td style="text-align:left;width: 10cm; "> SOE indicator expanded with modeled data to include area and other attributes </td> <td style="text-align:left;width: 2cm; "> 9 </td> </tr> <tr> <td style="text-align:left;width: 8cm; "> Shark diversity indicator </td> <td style="text-align:right;width: 1cm; "> 2020 </td> <td style="text-align:left;width: 2cm; "> MAFMC </td> <td style="text-align:left;width: 10cm; "> SOE multiple shark indicators added </td> <td style="text-align:left;width: 2cm; "> 10 </td> </tr> <tr> <td style="text-align:left;width: 8cm; "> Uncertainty estimates </td> <td style="text-align:right;width: 1cm; "> 2020 </td> <td style="text-align:left;width: 2cm; "> MAFMC </td> <td style="text-align:left;width: 10cm; "> SOE included for subset of indicators </td> <td style="text-align:left;width: 2cm; "> 11 </td> </tr> <tr> <td style="text-align:left;width: 8cm; "> Bycatch index </td> <td style="text-align:right;width: 1cm; "> 2020 </td> <td style="text-align:left;width: 2cm; "> NEFMC </td> <td style="text-align:left;width: 10cm; "> SOE added seal bycatch indicator, retained harbor porpoise indicator </td> <td style="text-align:left;width: 2cm; "> 12 </td> </tr> <tr> <td style="text-align:left;width: 8cm; "> Marine Mammal consumption </td> <td style="text-align:right;width: 1cm; "> 2019 </td> <td style="text-align:left;width: 2cm; "> MAFMC </td> <td style="text-align:left;width: 10cm; "> SOE added discussion of seal diets, memo no new consumption ests since Smith et al but could be in the future once work is complete </td> <td style="text-align:left;width: 2cm; "> 13 </td> </tr> <tr> <td style="text-align:left;width: 8cm; "> Estuarine Water Quality </td> <td style="text-align:right;width: 1cm; "> 2020 </td> <td style="text-align:left;width: 2cm; "> NEFMC </td> <td style="text-align:left;width: 10cm; "> SOE Chesapeake indicators updated and expanded </td> <td style="text-align:left;width: 2cm; "> 14 </td> </tr> <tr> <td style="text-align:left;width: 8cm; "> Linking Condition </td> <td style="text-align:right;width: 1cm; "> 2020 </td> <td style="text-align:left;width: 2cm; "> MAFMC </td> <td style="text-align:left;width: 10cm; "> in progress not ready for 2021 </td> <td style="text-align:left;width: 2cm; "> 15 </td> </tr> <tr> <td style="text-align:left;width: 8cm; "> Avg weight of diet components by feeding group </td> <td style="text-align:right;width: 1cm; "> 2019 </td> <td style="text-align:left;width: 2cm; "> Internal </td> <td style="text-align:left;width: 10cm; "> in progress part of fish condition ? stomach fullness analysis started--species level </td> <td style="text-align:left;width: 2cm; "> 16 </td> </tr> <tr> <td style="text-align:left;width: 8cm; "> Mean stomach weight across feeding guilds </td> <td style="text-align:right;width: 1cm; "> 2019 </td> <td style="text-align:left;width: 2cm; "> MAFMC </td> <td style="text-align:left;width: 10cm; "> in progress stomach fullness analysis started--species level </td> <td style="text-align:left;width: 2cm; "> 17 </td> </tr> <tr> <td style="text-align:left;width: 8cm; "> Shellfish growth/distribution linked to climate (system productivity) </td> <td style="text-align:right;width: 1cm; "> 2019 </td> <td style="text-align:left;width: 2cm; "> MAFMC </td> <td style="text-align:left;width: 10cm; "> in progress project with R Mann student to start 2021? </td> <td style="text-align:left;width: 2cm; "> 18 </td> </tr> <tr> <td style="text-align:left;width: 8cm; "> Cumulative weather index </td> <td style="text-align:right;width: 1cm; "> 2020 </td> <td style="text-align:left;width: 2cm; "> MAFMC </td> <td style="text-align:left;width: 10cm; "> in progress data gathered for prototype </td> <td style="text-align:left;width: 2cm; "> 19 </td> </tr> <tr> <td style="text-align:left;width: 8cm; "> Management complexity </td> <td style="text-align:right;width: 1cm; "> 2019 </td> <td style="text-align:left;width: 2cm; "> MAFMC </td> <td style="text-align:left;width: 10cm; "> in progress by summer student, needs further analysis, no further work in 2020 </td> <td style="text-align:left;width: 2cm; "> 20 </td> </tr> <tr> <td style="text-align:left;width: 8cm; "> VAST and uncertainty </td> <td style="text-align:right;width: 1cm; "> 2020 </td> <td style="text-align:left;width: 2cm; "> Both Councils </td> <td style="text-align:left;width: 10cm; "> ??? in progress not ready for 2021 </td> <td style="text-align:left;width: 2cm; "> 21 </td> </tr> <tr> <td style="text-align:left;width: 8cm; "> Seal index </td> <td style="text-align:right;width: 1cm; "> 2020 </td> <td style="text-align:left;width: 2cm; "> MAFMC </td> <td style="text-align:left;width: 10cm; "> ??? in progress not ready for 2021 </td> <td style="text-align:left;width: 2cm; "> 22 </td> </tr> <tr> <td style="text-align:left;width: 8cm; "> Seperate Bigelow/Albatross catch diversity metric </td> <td style="text-align:right;width: 1cm; "> 2020 </td> <td style="text-align:left;width: 2cm; "> MAFMC </td> <td style="text-align:left;width: 10cm; "> ??? not done </td> <td style="text-align:left;width: 2cm; "> 23 </td> </tr> <tr> <td style="text-align:left;width: 8cm; "> Incorporate social sciences survey from council </td> <td style="text-align:right;width: 1cm; "> 2020 </td> <td style="text-align:left;width: 2cm; "> NEFMC </td> <td style="text-align:left;width: 10cm; "> ??? check ??? not started </td> <td style="text-align:left;width: 2cm; "> 24 </td> </tr> <tr> <td style="text-align:left;width: 8cm; "> Young of Year index from multiple surveys </td> <td style="text-align:right;width: 1cm; "> 2019 </td> <td style="text-align:left;width: 2cm; "> MAFMC </td> <td style="text-align:left;width: 10cm; "> not started </td> <td style="text-align:left;width: 2cm; "> 25 </td> </tr> <tr> <td style="text-align:left;width: 8cm; "> Biomass of spp not included in BTS </td> <td style="text-align:right;width: 1cm; "> 2020 </td> <td style="text-align:left;width: 2cm; "> MAFMC </td> <td style="text-align:left;width: 10cm; "> not started </td> <td style="text-align:left;width: 2cm; "> 26 </td> </tr> <tr> <td style="text-align:left;width: 8cm; "> Estuarine condition relative to power plants and temp </td> <td style="text-align:right;width: 1cm; "> 2019 </td> <td style="text-align:left;width: 2cm; "> MAFMC </td> <td style="text-align:left;width: 10cm; "> not started </td> <td style="text-align:left;width: 2cm; "> 27 </td> </tr> <tr> <td style="text-align:left;width: 8cm; "> Inflection points for indicators </td> <td style="text-align:right;width: 1cm; "> 2019 </td> <td style="text-align:left;width: 2cm; "> Both Councils </td> <td style="text-align:left;width: 10cm; "> not started </td> <td style="text-align:left;width: 2cm; "> 28 </td> </tr> <tr> <td style="text-align:left;width: 8cm; "> Reduce indicator dimensionality with multivariate statistics </td> <td style="text-align:right;width: 1cm; "> 2020 </td> <td style="text-align:left;width: 2cm; "> NEFMC </td> <td style="text-align:left;width: 10cm; "> not started </td> <td style="text-align:left;width: 2cm; "> 29 </td> </tr> <tr> <td style="text-align:left;width: 8cm; "> Breakpoints </td> <td style="text-align:right;width: 1cm; "> 2020 </td> <td style="text-align:left;width: 2cm; "> NEFMC </td> <td style="text-align:left;width: 10cm; "> not started </td> <td style="text-align:left;width: 2cm; "> 30 </td> </tr> <tr> <td style="text-align:left;width: 8cm; "> Re-evaluate EPUs </td> <td style="text-align:right;width: 1cm; "> 2020 </td> <td style="text-align:left;width: 2cm; "> NEFMC </td> <td style="text-align:left;width: 10cm; "> not started </td> <td style="text-align:left;width: 2cm; "> 31 </td> </tr> </tbody> </table> --- ## Proposed ecosystem synthesis themes for 2021 Characterizing ecosystem change for fishery management: plain language summary for 2 pager * Multiple drivers of abundance, defined by the competing factors that influence the amount of fish in the ocean; * Regime shifts, or ecosystem change can happen rapidly as multiple drivers change; and, * Reorganization of the ecosystem, multiple factors that interact that change the structure and organization of the ecosystem, e.g. Tropicalization .pull-left[ 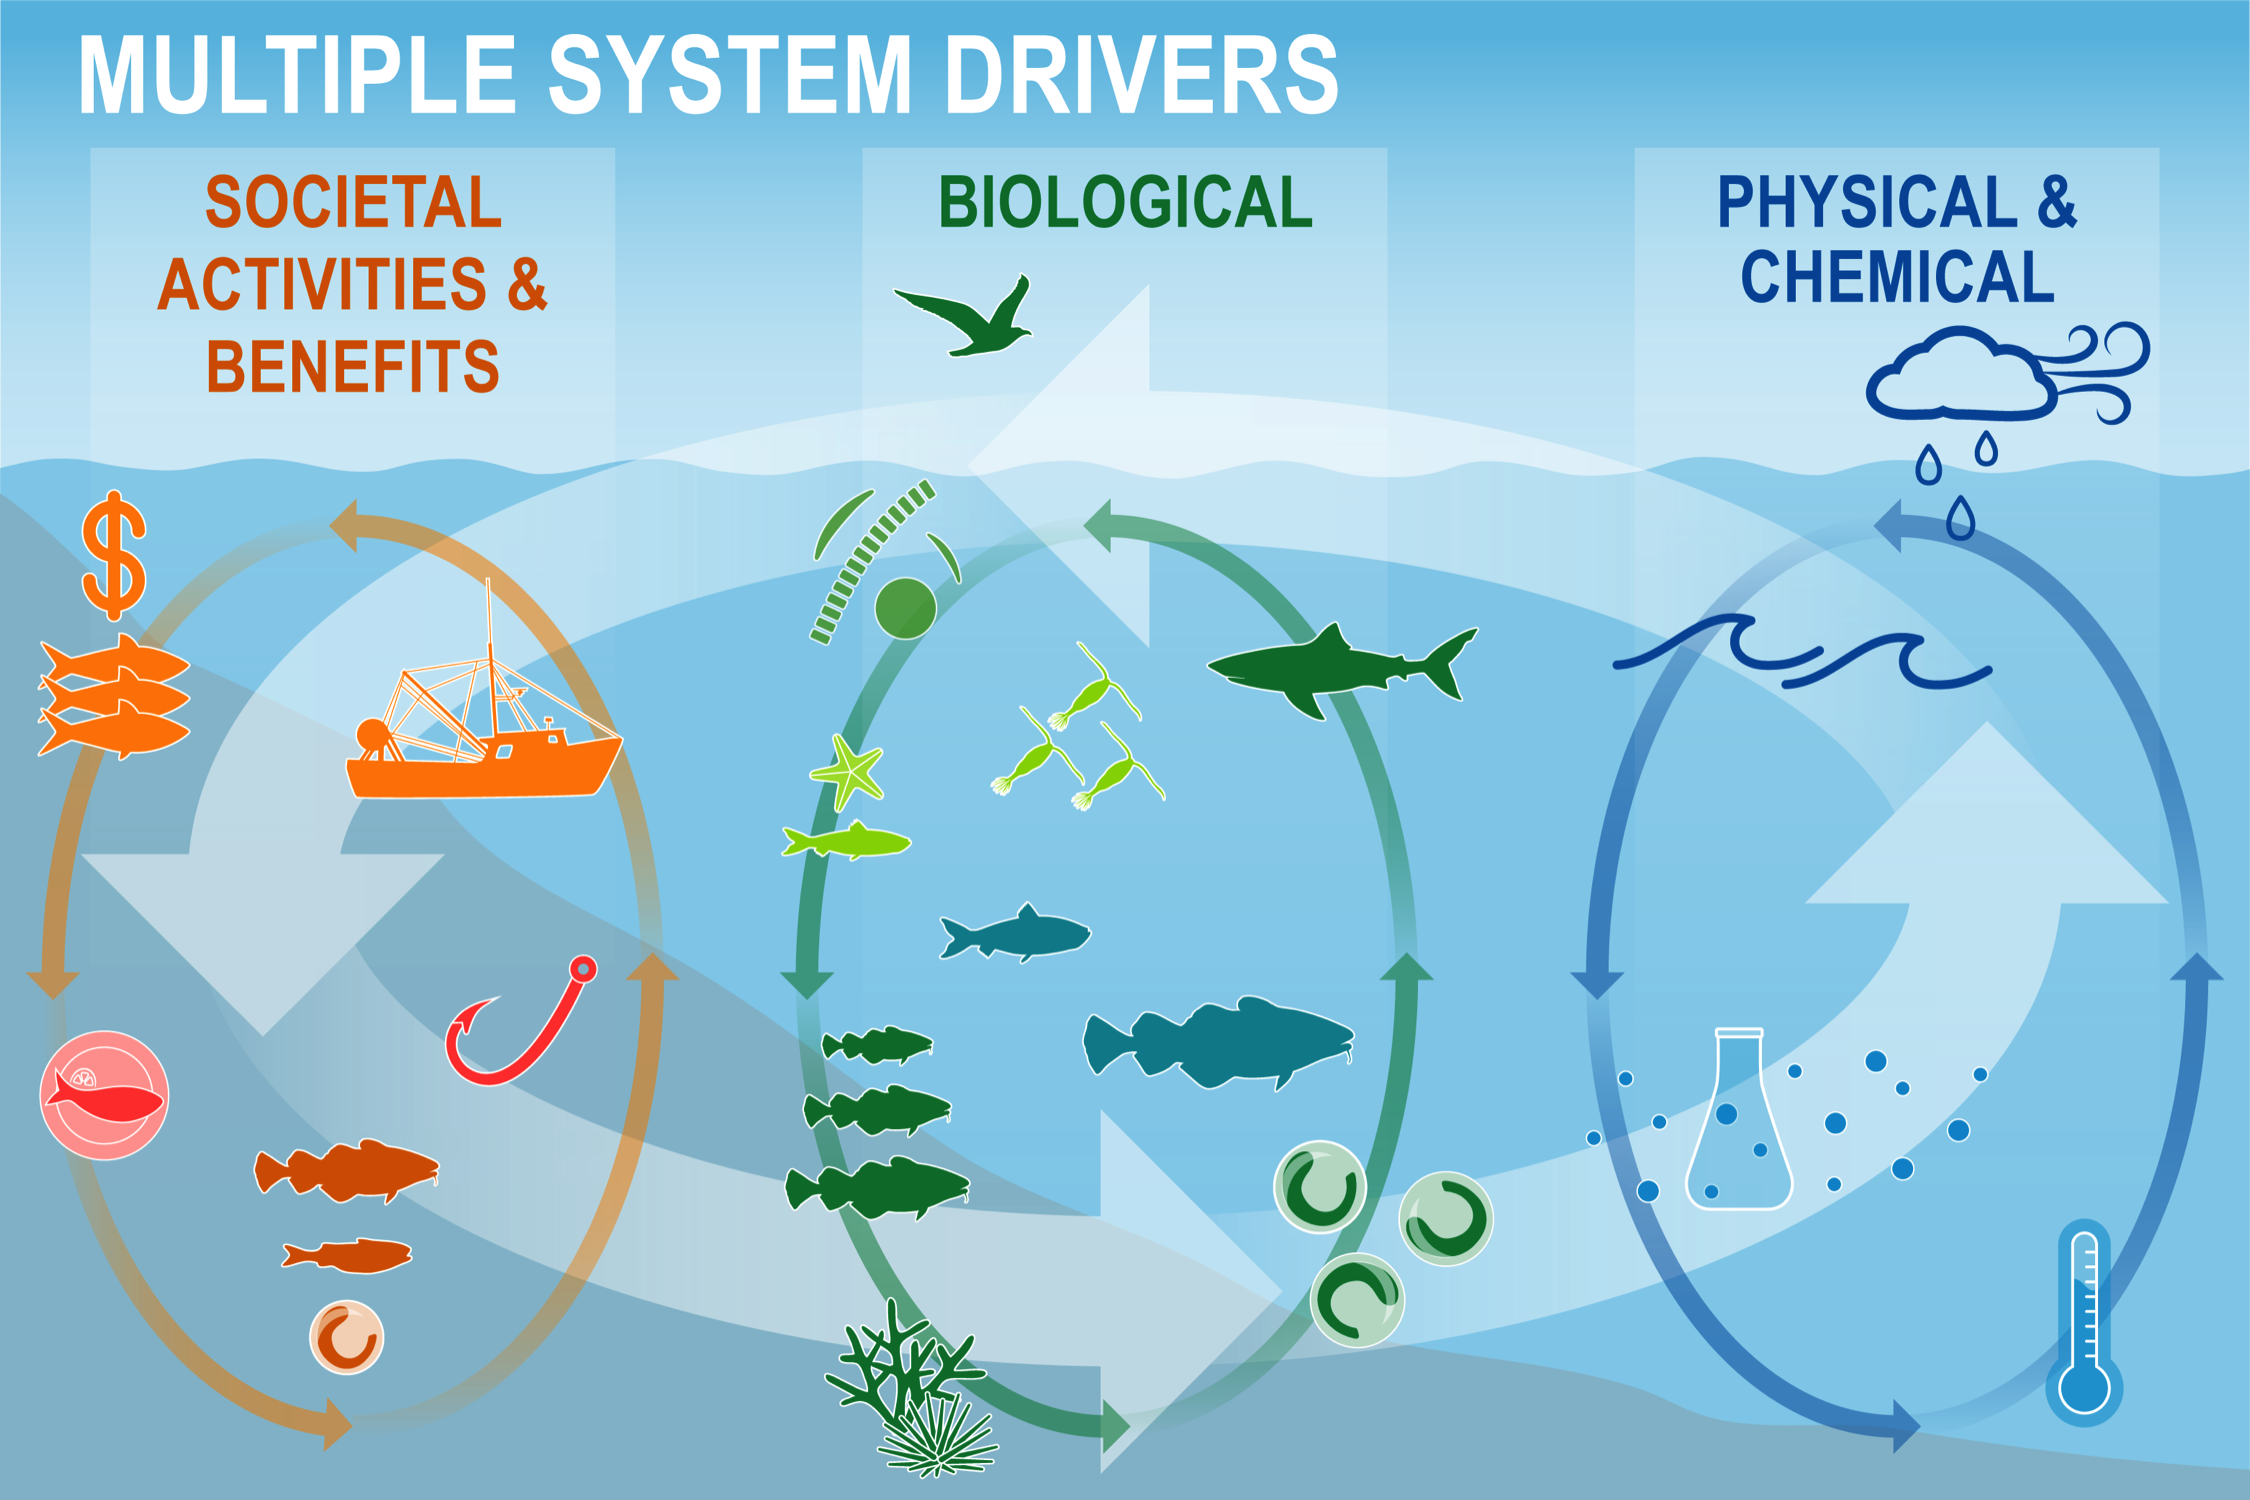 ] .pull-right[  ] --- ## Proposed outline: two sections, each with "what" and "why" .pull-left[ * Performance against management objectives - *What* does the indicator say--up, down, stable? - *Why* do we think it is changing: integrates synthesis themes - Multiple drivers - Regime shifts - Ecosystem reorganization * Objectives - Seafood production - Profits - Recreational opportunities - Stability - Social and cultural - Protected species ] .pull-right[ * Risks - *What* does the indicator say--up, down, stable? - *Why* this is important to managers: integrates synthesis themes - Multiple drivers - Regime shifts - Ecosystem reorganization * Risk categories - Climate: warming, ocean currents, acidification - Habitat changes (incl. vulnerability analysis) - Productivity changes (system and fish) - Species interaction changes - Community structure changes - Other ocean uses - Wind ] --- ## Example: Seafood production objective .pull-left[ Indicator: Total landings Trend: Decreasing Mid-Atlantic <img src="20210119_SOEsynthPlenary1_GaichasLucey_files/figure-html/unnamed-chunk-2-1.png" width="504" /> New England <img src="20210119_SOEsynthPlenary1_GaichasLucey_files/figure-html/unnamed-chunk-4-1.png" width="504" style="display: block; margin: auto;" /> ] .pull-right[ Why: multiple drivers: stock status/management, engagement, markets, fish population drivers <img src="20210119_SOEsynthPlenary1_GaichasLucey_files/figure-html/unnamed-chunk-6-1.png" width="504" style="display: block; margin: auto;" /> .center[] ] --- ## Multiple drivers of fish production analysis in progress: environment - fish condition - market price linkages     * Identify multiple and changing drivers of condition and market prices over time * Recognize regime shifts and potential system reorganization * Work in progress has identified the following potential drivers - *Temperature?* - *Zooplankton...? Laurel and team to specify* --- ## Example: Profits objective .pull-left[ Indicator: Total Revenue Mid-Atlantic <img src="20210119_SOEsynthPlenary1_GaichasLucey_files/figure-html/unnamed-chunk-7-1.png" width="504" style="display: block; margin: auto;" /> New England <img src="20210119_SOEsynthPlenary1_GaichasLucey_files/figure-html/unnamed-chunk-9-1.png" width="504" style="display: block; margin: auto;" /> ] .pull-right[ Why: multiple drivers: price and volume Mid-Atlantic <img src="20210119_SOEsynthPlenary1_GaichasLucey_files/figure-html/unnamed-chunk-11-1.png" width="504" style="display: block; margin: auto;" /> New England <img src="20210119_SOEsynthPlenary1_GaichasLucey_files/figure-html/unnamed-chunk-14-1.png" width="504" style="display: block; margin: auto;" /> ] --- ## Example: Recreational opportunities objective .pull-left[ Indicator: Recreational Landings Mid-Atlantic <img src="20210119_SOEsynthPlenary1_GaichasLucey_files/figure-html/unnamed-chunk-16-1.png" width="504" style="display: block; margin: auto;" /> New England <img src="20210119_SOEsynthPlenary1_GaichasLucey_files/figure-html/unnamed-chunk-18-1.png" width="504" style="display: block; margin: auto;" /> ] .pull-right[ Why: multiple drivers: Diversity Mid-Atlantic <img src="20210119_SOEsynthPlenary1_GaichasLucey_files/figure-html/unnamed-chunk-20-1.png" width="504" style="display: block; margin: auto;" /> ] --- ## Example: Stability objective .pull-left[ Indicator: Diversity in fishery/species Fishery (Mid-Atlantic) <img src="20210119_SOEsynthPlenary1_GaichasLucey_files/figure-html/unnamed-chunk-22-1.png" width="504" style="display: block; margin: auto;" /> <img src="20210119_SOEsynthPlenary1_GaichasLucey_files/figure-html/unnamed-chunk-23-1.png" width="504" style="display: block; margin: auto;" /> ] .pull-right[ Indicator: Zooplankton/Ichthyoplankton diversities <br /> <img src="20210119_SOEsynthPlenary1_GaichasLucey_files/figure-html/unnamed-chunk-24-1.png" width="504" style="display: block; margin: auto;" /> <img src="20210119_SOEsynthPlenary1_GaichasLucey_files/figure-html/unnamed-chunk-25-1.png" width="504" style="display: block; margin: auto;" /> ] --- ## Example: Stability objective Why? Multiple drivers - Consolidation of fleets? - Changing species interactions? - Links to risk section --- ## Example: Social and cultural objectives .pull-left[ Indicator: Recreational Vulnerability <img src="20210119_SOEsynthPlenary1_GaichasLucey_files/figure-html/unnamed-chunk-27-1.png" width="504" style="display: block; margin: auto;" /> Mid-Atlantic communities ] .pull-right[ Indicator: Commercial Vulnerability <br /> <img src="20210119_SOEsynthPlenary1_GaichasLucey_files/figure-html/unnamed-chunk-29-1.png" width="504" style="display: block; margin: auto;" /> ] --- ## Example: Social and cultural objectives Why? ... --- ## Example: Protected species objectives--add the "Why" linking to other SOE indicators .pull-left[ Indicators: Species By-catch <img src="20210119_SOEsynthPlenary1_GaichasLucey_files/figure-html/unnamed-chunk-30-1.png" width="504" style="display: block; margin: auto;" /> <img src="20210119_SOEsynthPlenary1_GaichasLucey_files/figure-html/unnamed-chunk-31-1.png" width="504" style="display: block; margin: auto;" /> ] .pull-right[ Indicators: Endangered Species Populations <img src="20210119_SOEsynthPlenary1_GaichasLucey_files/figure-html/unnamed-chunk-32-1.png" width="504" style="display: block; margin: auto;" /> <img src="20210119_SOEsynthPlenary1_GaichasLucey_files/figure-html/unnamed-chunk-33-1.png" width="504" style="display: block; margin: auto;" /> ] --- ## Example: Climate risks: multiple potential impacts on management .pull-left[ Indicators: Gulf Stream index, bottom and surface temperature, heat waves Trends: <img src="20210119_SOEsynthPlenary1_GaichasLucey_files/figure-html/unnamed-chunk-35-1.png" width="60%" style="display: block; margin: auto;" /> <img src="20210119_SOEsynthPlenary1_GaichasLucey_files/figure-html/unnamed-chunk-36-1.png" width="60%" style="display: block; margin: auto;" /> <img src="20210119_SOEsynthPlenary1_GaichasLucey_files/figure-html/unnamed-chunk-37-1.png" width="70%" style="display: block; margin: auto;" /> ] .pull-right[ Why this matters: Habitat change from multiple drivers alters: - species distributions--allocation - system productivity--fishery resource productivity <img src="20210119_SOEsynthPlenary1_GaichasLucey_files/figure-html/unnamed-chunk-38-1.png" width="504" style="display: block; margin: auto;" /> ] --- ## Example: Climate risks to species distribution--allocation issues .pull-left[ * Changing species distributions <img src="20210119_SOEsynthPlenary1_GaichasLucey_files/figure-html/unnamed-chunk-39-1.png" width="504" style="display: block; margin: auto;" /> ] .pull-right[ * Habitat conditions, habitat vulnerability <div id="htmlwidget-3a371e8309e928be230c" style="width:100%;height:504px;" class="widgetframe html-widget"></div> <script type="application/json" data-for="htmlwidget-3a371e8309e928be230c">{"x":{"url":"20210119_SOEsynthPlenary1_GaichasLucey_files/figure-html//widgets/widget_midHabTable1.html","options":{"xdomain":"*","allowfullscreen":false,"lazyload":false}},"evals":[],"jsHooks":[]}</script> ] --- ## Example: Climate risks to species production--fishery yields .pull-left[ * OA impact on shellfish growth - Areas of low pH identified in surfclam and scallop habitat - Lab work in progress identified pH thresholds for surfclam growth: *approaching threshold* .contrib[ * Ecosystem productivity link to fishery productivity - Condition links work in progress - [Forage energy density](https://noaa-edab.github.io/ecodata/macrofauna_MAB#forage-fish-energy-content) - Other examples? * Diversity changes (tropicalizaton? affects species available for fishing, FMPs) - Recreational catch diversity in Mid supported by "southern" species * Predation increasing? sharks, seals - [Shark bycatch stable](https://noaa-edab.github.io/ecodata/macrofauna_MAB#Observed_Shark_Numbers) - Seal population increasing, diet work in progress ] ] .pull-right[  ] --- ## Example: Other ocean uses (Wind): area covered, fisheries impacted .pull-left[  ] .pull-right[ <img src="20210119_SOEsynthPlenary1_GaichasLucey_files/figure-html/unnamed-chunk-40-1.png" width="504" style="display: block; margin: auto;" /> <img src="20210119_SOEsynthPlenary1_GaichasLucey_files/figure-html/unnamed-chunk-41-1.png" width="504" style="display: block; margin: auto;" /> ] --- ## Future: Better integration of habitats with managed species for managers * Mid-Atlantic Council very interested in estuarine conditions and habitat supporting managed stocks * Chesapeake Bay has excellent indicators and synthesis * Prioritize next steps for identifying high risk combinations: Key species, habitats, and drivers * 2021 SOE introduces Habitat Climate Vulerability Assessment results linked to species <div id="htmlwidget-a88ccfe9e29faab9d0fb" style="width:100%;height:504px;" class="widgetframe html-widget"></div> <script type="application/json" data-for="htmlwidget-a88ccfe9e29faab9d0fb">{"x":{"url":"20210119_SOEsynthPlenary1_GaichasLucey_files/figure-html//widgets/widget_midHabTable.html","options":{"xdomain":"*","allowfullscreen":false,"lazyload":false}},"evals":[],"jsHooks":[]}</script> --- # Our charge this week 1. Finalize structure and outline 1. Are current examples correct? 1. Fill in the "why" emphasizing synthesis themes: multiple drivers, regime shifts, system reorganization - In each topical break out meeting - Together at the synthesis break out Thursday - *Where does your indicator fit in? Multiple places* 1. Develop main messages for front page 1. Finalize main messages Friday plenary # Thank you! --- ## References .contrib[ <a name=bib-bastille_improving_2020></a>[Bastille, K. et al.](#cite-bastille_improving_2020) (2020). "Improving the IEA Approach Using Principles of Open Data Science". In: _Coastal Management_ 0.0. Publisher: Taylor & Francis \_ eprint: https://doi.org/10.1080/08920753.2021.1846155, pp. 1-18. ISSN: 0892-0753. DOI: [10.1080/08920753.2021.1846155](https://doi.org/10.1080%2F08920753.2021.1846155). URL: [https://doi.org/10.1080/08920753.2021.1846155](https://doi.org/10.1080/08920753.2021.1846155) (visited on Dec. 09, 2020). <a name=bib-depiper_operationalizing_2017></a>[DePiper, G. S. et al.](#cite-depiper_operationalizing_2017) (2017). "Operationalizing integrated ecosystem assessments within a multidisciplinary team: lessons learned from a worked example". En. In: _ICES Journal of Marine Science_ 74.8, pp. 2076-2086. ISSN: 1054-3139. DOI: [10.1093/icesjms/fsx038](https://doi.org/10.1093%2Ficesjms%2Ffsx038). URL: [https://academic.oup.com/icesjms/article/74/8/2076/3094701](https://academic.oup.com/icesjms/article/74/8/2076/3094701) (visited on Mar. 09, 2018). <a name=bib-muffley_there_2020></a>[Muffley, B. et al.](#cite-muffley_there_2020) (2020). "There Is no I in EAFM Adapting Integrated Ecosystem Assessment for Mid-Atlantic Fisheries Management". In: _Coastal Management_ 0.0. Publisher: Taylor & Francis \_ eprint: https://doi.org/10.1080/08920753.2021.1846156, pp. 1-17. ISSN: 0892-0753. DOI: [10.1080/08920753.2021.1846156](https://doi.org/10.1080%2F08920753.2021.1846156). URL: [https://doi.org/10.1080/08920753.2021.1846156](https://doi.org/10.1080/08920753.2021.1846156) (visited on Dec. 09, 2020). ] ## Additional resources .pull-left[ * [ecodata R package](https://github.com/noaa-edab/ecodata) * Visualizations: * [Mid-Atlantic Human Dimensions indicators](http://noaa-edab.github.io/ecodata/human_dimensions_MAB) * [Mid-Atlantic Macrofauna indicators](http://noaa-edab.github.io/ecodata/macrofauna_MAB) * [Mid-Atlantic Lower trophic level indicators](https://noaa-edab.github.io/ecodata/LTL_MAB) * [New England Human Dimensions indicators](http://noaa-edab.github.io/ecodata/human_dimensions_NE) * [New England Macrofauna indicators](http://noaa-edab.github.io/ecodata/macrofauna_NE) * [New England Lower trophic level indicators](https://noaa-edab.github.io/ecodata/LTL_NE) ] .pull-right[ * [SOE Technical Documentation](https://noaa-edab.github.io/tech-doc) * [State of the Ecosystem Reports](https://www.fisheries.noaa.gov/new-england-mid-atlantic/ecosystems/state-ecosystem-reports-northeast-us-shelf) * [Draft indicator catalogue](https://noaa-edab.github.io/catalog/) .contrib[ * Slides available at https://noaa-edab.github.io/presentations * Contact: <Sarah.Gaichas@noaa.gov> ] ]