class: right, middle, my-title, title-slide # Mid-Atlantic State of the Ecosystem Report ## Chesapeake Bay Program Goal Implementation Team Meeting<br /> 14 January 2021 ### Sarah Gaichas<br /> Northeast Fisheries Science Center<br /> <br /> Many thanks to:<br /> Kimberly Bastille, Geret DePiper, Kimberly Hyde, Scott Large, Sean Lucey, Bruce Vogt,<br /> and all SOE contributors --- class: top, left # State of the Ecosystem (SOE) reporting ## Improving ecosystem information and synthesis for fishery managers .pull-left[ - Ecosystem indicators linked to management objectives <a name=cite-depiper_operationalizing_2017></a>([DePiper, et al., 2017](https://academic.oup.com/icesjms/article/74/8/2076/3094701)) + Contextual information + Report evolving since 2016 + Fishery-relevant subset of full Ecosystem Status Reprorts - Open science emphasis <a name=cite-bastille_improving_2020></a>([Bastille, et al., 2020](https://doi.org/10.1080/08920753.2021.1846155)) - Used within Mid-Atlantic Fishery Management Council's Ecosystem Process <a name=cite-muffley_there_2020></a>([Muffley, et al., 2020](https://doi.org/10.1080/08920753.2021.1846156)) ] .pull-right[ *The IEA Loop<sup>1</sup>* 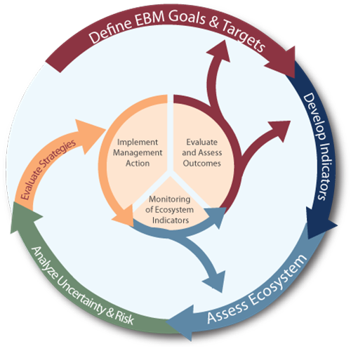 .footnote[ [1] https://www.integratedecosystemassessment.noaa.gov/national/IEA-approach ] ] ??? Meeting Purpose: ● Deliver emerging science and improve cross-jurisdictional collaboration to improve fishery management decisions ● Lead forums that bring the management and science communities together to learn about the latest fisheries and habitat science, discuss management implications, identify new science priorities, and identify funding opportunities Presentation Content: ● Keep in mind - we want to ensure presentations are palatable and engaging for a broad membership audience. ● Points of focus: ○ Importance of research ○ Key findings or updates ○ Connections to management implications ○ New arising questions and next steps ● Points to generally avoid: ○ Technical slides focusing on project methodology ■ Feel free to still include method slides (at the end of your presentation) to have as an available resource during group discussion --- background-image: url("EDAB_images/Framework.png") background-size: 540px background-position: right ## Mid-Atlantic Fishery Management Council Ecosystem Approach ([Muffley, et al., 2020](https://doi.org/10.1080/08920753.2021.1846156)) .pull-left-60[ 2016 EAFM Policy Guidance document; revised 2019<sup>1</sup> 2016 MAFMC EAFM framework <a name=cite-gaichas_framework_2016></a>([Gaichas, et al., 2016](https://www.frontiersin.org/articles/10.3389/fmars.2016.00105/full)) 2017 Inital EAFM risk assessment completed; revised and published 2018 <a name=cite-gaichas_implementing_2018></a>([Gaichas, et al., 2018](https://www.frontiersin.org/articles/10.3389/fmars.2018.00442/abstract)) 2018 Council selected summer flounder as high risk fishery 2019 EAFM conceptual model linking summer flounder drivers and risks (DePiper et al., in review) 2020 Council starting EAFM MSE for summer flounder recreational discards SOE indicators to be used for annual risk assessment updates *But can managers get more from the SOE and risk assessment?* ] .pull-right-40[ .footnote[ [1] http://www.mafmc.org/s/EAFM-Doc-Revised-2019-02-08.pdf ] ] ??? The Council’s EAFM framework has similarities to the IEA loop on slide 2. It uses risk assessment as a first step to prioritize combinations of managed species, fleets, and ecosystem interactions for consideration. Second, a conceptual model is developed identifying key environmental, ecological, social, economic, and management linkages for a high-priority fishery. Third, quantitative modeling addressing Council-specified questions and based on interactions identified in the conceptual model is applied to evaluate alternative management strategies that best balance management objectives. As strategies are implemented, outcomes are monitored and the process is adjusted, and/or another priority identified in risk assessment can be addressed. --- background-image: url("EDAB_images/nes-components-abstracted.png") background-size: 700px background-position: right bottom ## State of the Ecosystem (SOE) Reporting: Context for busy people *"So what?" --John Boreman, September 2016* 1. Clear linkage of ecosystem indicators with management objectives 1. Synthesis across indicators for big picture 1. Objectives related to human-well being placed first in report 1. Short (< 30 pages), non-technical (but rigorous) text 1. Emphasis on reproducibility ??? In 2016, we began taking steps to address these common critiques of the ESR model --- ## State of the Ecosystem: Structure .pull-left[ ## 2020 Report 1. Summary 2 pager 1. Human dimensions 1. Protected species 1. Fish and invertebrates (managed and otherwise) 1. Habitat quality and ecosystem productivity ## 2021 Draft 1. Summary 2 pager + Page 1 summary bullets + Page 2 synthesis themes 1. Performance against management objectives 1. Risks ] .pull-right[ *Established ecosystem-scale objectives* <table class="table" style="font-size: 14px; margin-left: auto; margin-right: auto;"> <thead> <tr> <th style="text-align:left;font-weight: bold;"> Objective Categories </th> <th style="text-align:left;font-weight: bold;"> Indicators reported here </th> </tr> </thead> <tbody> <tr grouplength="4"><td colspan="2" style="border-bottom: 1px solid;"><strong>Provisioning/Cultural</strong></td></tr> <tr> <td style="text-align:left; padding-left: 2em;" indentlevel="1"> Seafood Production </td> <td style="text-align:left;"> Landings by feeding guild </td> </tr> <tr> <td style="text-align:left; padding-left: 2em;" indentlevel="1"> Profits </td> <td style="text-align:left;"> Revenue decomposed to price and volume </td> </tr> <tr> <td style="text-align:left; padding-left: 2em;" indentlevel="1"> Recreation </td> <td style="text-align:left;"> Days fished; recreational catch </td> </tr> <tr> <td style="text-align:left; padding-left: 2em;" indentlevel="1"> Social & Cultural </td> <td style="text-align:left;"> Commercial engagement trends </td> </tr> <tr grouplength="5"><td colspan="2" style="border-bottom: 1px solid;"><strong>Supporting/Regulating</strong></td></tr> <tr> <td style="text-align:left; padding-left: 2em;" indentlevel="1"> Stability </td> <td style="text-align:left;"> Diversity indices (fishery and species) </td> </tr> <tr> <td style="text-align:left; padding-left: 2em;" indentlevel="1"> Biomass </td> <td style="text-align:left;"> Biomass or abundance by feeding guild from surveys </td> </tr> <tr> <td style="text-align:left; padding-left: 2em;" indentlevel="1"> Productivity </td> <td style="text-align:left;"> Condition and recruitment of managed species, Primary productivity </td> </tr> <tr> <td style="text-align:left; padding-left: 2em;" indentlevel="1"> Trophic structure </td> <td style="text-align:left;"> Relative biomass of feeding guilds, Zooplankton </td> </tr> <tr> <td style="text-align:left; padding-left: 2em;" indentlevel="1"> Habitat </td> <td style="text-align:left;"> Estuarine and offshore habitat conditions </td> </tr> </tbody> </table> ] --- ## [2020 Report](https://doi.org/10.25923/1f8j-d564): Summary 2 pager with visualizations, 28 pages of narrative/plots, 1 page orientation .pull-left[ .center[  ] ] .pull-right[ .center[  ] ] --- ## 2020 Mid-Atlantic SOE Take Home Messages .center[    ] * The fraction of ecosystem energy removed by fisheries is declining (commercial landings declined while primary production remained steady) * Commercial fishing engagement has declined for medium-highly engaged communities, possibly linked to continued declines in revenue * Recreational retained catch was lowest observed in 2018, and effort has been declining along with fleet effort diversity * Recreational catch diversity has been maintained by SAFMC/ASMFC species --- ## 2020 Mid-Atlantic SOE Take Home Messages .center[    ] * Habitat models identified species most likely to occur in wind lease areas; habitat has improved in wind lease areas for these MAFMC species * While aggregate fish biomass is stable over time, shifts to the northeast and into deeper water continue * Forage fish energy content varies by season and year; herring energy content may be half what it was in the 1980s-90s --- ## 2020 Mid-Atlantic SOE Take Home Messages .center[    ] * Heavy rains put unprecedented fresh water and nutrients into Chesapeake Bay in 2018-2019, increasing oyster mortality and spreading invasive catfish * Gulf stream instability produces more warm core rings with higher likelihood of warm salty water and associated species on the shelf * Marine surface water heatwaves are increasing in duration and intensity, bottom temperatures and the cold pool are warming * Warmer waters increase nutrient recycling and summer primary production --- ## Proposed ecosystem synthesis themes for 2021 Characterizing ecosystem change for fishery management: plain language summary for 2 pager * Multiple drivers of abundance, defined by the competing factors that influence the amount of fish in the ocean; * Regime shifts, or ecosystem change can happen rapidly as multiple drivers change; and, * Reorganization of the ecosystem, multiple factors that interact that change the structure and organization of the ecosystem, e.g. Tropicalization ## Synthetic analysis in progress: environment - fish condition - market price linkages     * Identify multiple and changing drivers of condition and market prices over time * Recognize regime shifts and potential system reorganization --- ## Sustained Interest in Estuarine Water Quality and Resource Impacts .pull-left[ *Chesapeake Bay water quality update--2020 report* <div class="figure"> <img src="20210114_ChesapeakeFishGIT_Gaichas_files/figure-html/cb-salinity-1.png" alt="Salinity in Chesapeake Bay throughout 2018 (blue) and 2019 (red) as well as the daily average 2008-2019 (black) and the full observed range 2008-2019 (gray shading)." width="360" /> <p class="caption">Salinity in Chesapeake Bay throughout 2018 (blue) and 2019 (red) as well as the daily average 2008-2019 (black) and the full observed range 2008-2019 (gray shading).</p> </div> High precipitation led to extreme low salinity event in spring 2019 ] .pull-right[ *Linking to living resources: *[*Indicator catalogue*](https://noaa-edab.github.io/catalog/chesapeake-bay-salinity.html) - Low dissolved oxygen - Low spat set and high oyster mortality in upper Bay and Potomac <img src="EDAB_images/ches_bay_salinity_map2.png" width="161" /><img src="EDAB_images/ches_bay_salinity_map3.png" width="160" /> - Invasive freshwater species (blue catfish) spread ] --- ## Current management use: EAFM risk assessment .pull-left[ *Species level risk elements* <table class="risktable table" style="font-size: 9px; margin-left: auto; margin-right: auto;"> <thead> <tr> <th style="text-align:left;"> Species </th> <th style="text-align:left;"> Assess </th> <th style="text-align:left;"> Fstatus </th> <th style="text-align:left;"> Bstatus </th> <th style="text-align:left;"> FW1Pred </th> <th style="text-align:left;"> FW1Prey </th> <th style="text-align:left;"> FW2Prey </th> <th style="text-align:left;"> Climate </th> <th style="text-align:left;"> DistShift </th> <th style="text-align:left;"> EstHabitat </th> </tr> </thead> <tbody> <tr> <td style="text-align:left;"> Ocean Quahog </td> <td style="text-align:left;"> <span style=" color: black !important;padding-right: 4px; padding-left: 4px; background-color: lightgreen !important;text-align: c;">lowest</span> </td> <td style="text-align:left;"> <span style=" color: black !important;padding-right: 4px; padding-left: 4px; background-color: lightgreen !important;text-align: c;">lowest</span> </td> <td style="text-align:left;"> <span style=" color: black !important;padding-right: 4px; padding-left: 4px; background-color: lightgreen !important;text-align: c;">lowest</span> </td> <td style="text-align:left;"> <span style=" color: black !important;padding-right: 4px; padding-left: 4px; background-color: lightgreen !important;text-align: c;">lowest</span> </td> <td style="text-align:left;"> <span style=" color: black !important;padding-right: 4px; padding-left: 4px; background-color: lightgreen !important;text-align: c;">lowest</span> </td> <td style="text-align:left;"> <span style=" color: black !important;padding-right: 4px; padding-left: 4px; background-color: lightgreen !important;text-align: c;">lowest</span> </td> <td style="text-align:left;"> <span style=" color: white !important;padding-right: 4px; padding-left: 4px; background-color: red !important;text-align: c;">highest</span> </td> <td style="text-align:left;"> <span style=" color: black !important;padding-right: 4px; padding-left: 4px; background-color: orange !important;text-align: c;">modhigh</span> </td> <td style="text-align:left;"> <span style=" color: black !important;padding-right: 4px; padding-left: 4px; background-color: lightgreen !important;text-align: c;">lowest</span> </td> </tr> <tr> <td style="text-align:left;"> Surfclam </td> <td style="text-align:left;"> <span style=" color: black !important;padding-right: 4px; padding-left: 4px; background-color: lightgreen !important;text-align: c;">lowest</span> </td> <td style="text-align:left;"> <span style=" color: black !important;padding-right: 4px; padding-left: 4px; background-color: lightgreen !important;text-align: c;">lowest</span> </td> <td style="text-align:left;"> <span style=" color: black !important;padding-right: 4px; padding-left: 4px; background-color: lightgreen !important;text-align: c;">lowest</span> </td> <td style="text-align:left;"> <span style=" color: black !important;padding-right: 4px; padding-left: 4px; background-color: lightgreen !important;text-align: c;">lowest</span> </td> <td style="text-align:left;"> <span style=" color: black !important;padding-right: 4px; padding-left: 4px; background-color: lightgreen !important;text-align: c;">lowest</span> </td> <td style="text-align:left;"> <span style=" color: black !important;padding-right: 4px; padding-left: 4px; background-color: lightgreen !important;text-align: c;">lowest</span> </td> <td style="text-align:left;"> <span style=" color: black !important;padding-right: 4px; padding-left: 4px; background-color: orange !important;text-align: c;">modhigh</span> </td> <td style="text-align:left;"> <span style=" color: black !important;padding-right: 4px; padding-left: 4px; background-color: orange !important;text-align: c;">modhigh</span> </td> <td style="text-align:left;"> <span style=" color: black !important;padding-right: 4px; padding-left: 4px; background-color: lightgreen !important;text-align: c;">lowest</span> </td> </tr> <tr> <td style="text-align:left;"> Summer flounder </td> <td style="text-align:left;"> <span style=" color: black !important;padding-right: 4px; padding-left: 4px; background-color: lightgreen !important;text-align: c;">lowest</span> </td> <td style="text-align:left;"> <span style=" color: black !important;padding-right: 4px; padding-left: 4px; background-color: lightgreen !important;text-align: c;">lowest</span> </td> <td style="text-align:left;"> <span style=" color: black !important;padding-right: 4px; padding-left: 4px; background-color: yellow !important;text-align: c;">lowmod</span> </td> <td style="text-align:left;"> <span style=" color: black !important;padding-right: 4px; padding-left: 4px; background-color: lightgreen !important;text-align: c;">lowest</span> </td> <td style="text-align:left;"> <span style=" color: black !important;padding-right: 4px; padding-left: 4px; background-color: lightgreen !important;text-align: c;">lowest</span> </td> <td style="text-align:left;"> <span style=" color: black !important;padding-right: 4px; padding-left: 4px; background-color: lightgreen !important;text-align: c;">lowest</span> </td> <td style="text-align:left;"> <span style=" color: black !important;padding-right: 4px; padding-left: 4px; background-color: yellow !important;text-align: c;">lowmod</span> </td> <td style="text-align:left;"> <span style=" color: black !important;padding-right: 4px; padding-left: 4px; background-color: orange !important;text-align: c;">modhigh</span> </td> <td style="text-align:left;"> <span style=" color: white !important;padding-right: 4px; padding-left: 4px; background-color: red !important;text-align: c;">highest</span> </td> </tr> <tr> <td style="text-align:left;"> Scup </td> <td style="text-align:left;"> <span style=" color: black !important;padding-right: 4px; padding-left: 4px; background-color: lightgreen !important;text-align: c;">lowest</span> </td> <td style="text-align:left;"> <span style=" color: black !important;padding-right: 4px; padding-left: 4px; background-color: lightgreen !important;text-align: c;">lowest</span> </td> <td style="text-align:left;"> <span style=" color: black !important;padding-right: 4px; padding-left: 4px; background-color: lightgreen !important;text-align: c;">lowest</span> </td> <td style="text-align:left;"> <span style=" color: black !important;padding-right: 4px; padding-left: 4px; background-color: lightgreen !important;text-align: c;">lowest</span> </td> <td style="text-align:left;"> <span style=" color: black !important;padding-right: 4px; padding-left: 4px; background-color: lightgreen !important;text-align: c;">lowest</span> </td> <td style="text-align:left;"> <span style=" color: black !important;padding-right: 4px; padding-left: 4px; background-color: lightgreen !important;text-align: c;">lowest</span> </td> <td style="text-align:left;"> <span style=" color: black !important;padding-right: 4px; padding-left: 4px; background-color: yellow !important;text-align: c;">lowmod</span> </td> <td style="text-align:left;"> <span style=" color: black !important;padding-right: 4px; padding-left: 4px; background-color: orange !important;text-align: c;">modhigh</span> </td> <td style="text-align:left;"> <span style=" color: white !important;padding-right: 4px; padding-left: 4px; background-color: red !important;text-align: c;">highest</span> </td> </tr> <tr> <td style="text-align:left;"> Black sea bass </td> <td style="text-align:left;"> <span style=" color: black !important;padding-right: 4px; padding-left: 4px; background-color: lightgreen !important;text-align: c;">lowest</span> </td> <td style="text-align:left;"> <span style=" color: black !important;padding-right: 4px; padding-left: 4px; background-color: lightgreen !important;text-align: c;">lowest</span> </td> <td style="text-align:left;"> <span style=" color: black !important;padding-right: 4px; padding-left: 4px; background-color: lightgreen !important;text-align: c;">lowest</span> </td> <td style="text-align:left;"> <span style=" color: black !important;padding-right: 4px; padding-left: 4px; background-color: lightgreen !important;text-align: c;">lowest</span> </td> <td style="text-align:left;"> <span style=" color: black !important;padding-right: 4px; padding-left: 4px; background-color: lightgreen !important;text-align: c;">lowest</span> </td> <td style="text-align:left;"> <span style=" color: black !important;padding-right: 4px; padding-left: 4px; background-color: lightgreen !important;text-align: c;">lowest</span> </td> <td style="text-align:left;"> <span style=" color: black !important;padding-right: 4px; padding-left: 4px; background-color: orange !important;text-align: c;">modhigh</span> </td> <td style="text-align:left;"> <span style=" color: black !important;padding-right: 4px; padding-left: 4px; background-color: orange !important;text-align: c;">modhigh</span> </td> <td style="text-align:left;"> <span style=" color: white !important;padding-right: 4px; padding-left: 4px; background-color: red !important;text-align: c;">highest</span> </td> </tr> <tr> <td style="text-align:left;"> Atl. mackerel </td> <td style="text-align:left;"> <span style=" color: black !important;padding-right: 4px; padding-left: 4px; background-color: lightgreen !important;text-align: c;">lowest</span> </td> <td style="text-align:left;"> <span style=" color: white !important;padding-right: 4px; padding-left: 4px; background-color: red !important;text-align: c;">highest</span> </td> <td style="text-align:left;"> <span style=" color: white !important;padding-right: 4px; padding-left: 4px; background-color: red !important;text-align: c;">highest</span> </td> <td style="text-align:left;"> <span style=" color: black !important;padding-right: 4px; padding-left: 4px; background-color: lightgreen !important;text-align: c;">lowest</span> </td> <td style="text-align:left;"> <span style=" color: black !important;padding-right: 4px; padding-left: 4px; background-color: lightgreen !important;text-align: c;">lowest</span> </td> <td style="text-align:left;"> <span style=" color: black !important;padding-right: 4px; padding-left: 4px; background-color: lightgreen !important;text-align: c;">lowest</span> </td> <td style="text-align:left;"> <span style=" color: black !important;padding-right: 4px; padding-left: 4px; background-color: yellow !important;text-align: c;">lowmod</span> </td> <td style="text-align:left;"> <span style=" color: black !important;padding-right: 4px; padding-left: 4px; background-color: orange !important;text-align: c;">modhigh</span> </td> <td style="text-align:left;"> <span style=" color: black !important;padding-right: 4px; padding-left: 4px; background-color: lightgreen !important;text-align: c;">lowest</span> </td> </tr> <tr> <td style="text-align:left;"> Butterfish </td> <td style="text-align:left;"> <span style=" color: black !important;padding-right: 4px; padding-left: 4px; background-color: lightgreen !important;text-align: c;">lowest</span> </td> <td style="text-align:left;"> <span style=" color: black !important;padding-right: 4px; padding-left: 4px; background-color: lightgreen !important;text-align: c;">lowest</span> </td> <td style="text-align:left;"> <span style=" color: black !important;padding-right: 4px; padding-left: 4px; background-color: lightgreen !important;text-align: c;">lowest</span> </td> <td style="text-align:left;"> <span style=" color: black !important;padding-right: 4px; padding-left: 4px; background-color: lightgreen !important;text-align: c;">lowest</span> </td> <td style="text-align:left;"> <span style=" color: black !important;padding-right: 4px; padding-left: 4px; background-color: lightgreen !important;text-align: c;">lowest</span> </td> <td style="text-align:left;"> <span style=" color: black !important;padding-right: 4px; padding-left: 4px; background-color: lightgreen !important;text-align: c;">lowest</span> </td> <td style="text-align:left;"> <span style=" color: black !important;padding-right: 4px; padding-left: 4px; background-color: lightgreen !important;text-align: c;">lowest</span> </td> <td style="text-align:left;"> <span style=" color: white !important;padding-right: 4px; padding-left: 4px; background-color: red !important;text-align: c;">highest</span> </td> <td style="text-align:left;"> <span style=" color: black !important;padding-right: 4px; padding-left: 4px; background-color: lightgreen !important;text-align: c;">lowest</span> </td> </tr> <tr> <td style="text-align:left;"> Longfin squid </td> <td style="text-align:left;"> <span style=" color: black !important;padding-right: 4px; padding-left: 4px; background-color: yellow !important;text-align: c;">lowmod</span> </td> <td style="text-align:left;"> <span style=" color: black !important;padding-right: 4px; padding-left: 4px; background-color: yellow !important;text-align: c;">lowmod</span> </td> <td style="text-align:left;"> <span style=" color: black !important;padding-right: 4px; padding-left: 4px; background-color: yellow !important;text-align: c;">lowmod</span> </td> <td style="text-align:left;"> <span style=" color: black !important;padding-right: 4px; padding-left: 4px; background-color: lightgreen !important;text-align: c;">lowest</span> </td> <td style="text-align:left;"> <span style=" color: black !important;padding-right: 4px; padding-left: 4px; background-color: lightgreen !important;text-align: c;">lowest</span> </td> <td style="text-align:left;"> <span style=" color: black !important;padding-right: 4px; padding-left: 4px; background-color: yellow !important;text-align: c;">lowmod</span> </td> <td style="text-align:left;"> <span style=" color: black !important;padding-right: 4px; padding-left: 4px; background-color: lightgreen !important;text-align: c;">lowest</span> </td> <td style="text-align:left;"> <span style=" color: black !important;padding-right: 4px; padding-left: 4px; background-color: orange !important;text-align: c;">modhigh</span> </td> <td style="text-align:left;"> <span style=" color: black !important;padding-right: 4px; padding-left: 4px; background-color: lightgreen !important;text-align: c;">lowest</span> </td> </tr> <tr> <td style="text-align:left;"> Shortfin squid </td> <td style="text-align:left;"> <span style=" color: black !important;padding-right: 4px; padding-left: 4px; background-color: yellow !important;text-align: c;">lowmod</span> </td> <td style="text-align:left;"> <span style=" color: black !important;padding-right: 4px; padding-left: 4px; background-color: yellow !important;text-align: c;">lowmod</span> </td> <td style="text-align:left;"> <span style=" color: black !important;padding-right: 4px; padding-left: 4px; background-color: yellow !important;text-align: c;">lowmod</span> </td> <td style="text-align:left;"> <span style=" color: black !important;padding-right: 4px; padding-left: 4px; background-color: lightgreen !important;text-align: c;">lowest</span> </td> <td style="text-align:left;"> <span style=" color: black !important;padding-right: 4px; padding-left: 4px; background-color: lightgreen !important;text-align: c;">lowest</span> </td> <td style="text-align:left;"> <span style=" color: black !important;padding-right: 4px; padding-left: 4px; background-color: yellow !important;text-align: c;">lowmod</span> </td> <td style="text-align:left;"> <span style=" color: black !important;padding-right: 4px; padding-left: 4px; background-color: lightgreen !important;text-align: c;">lowest</span> </td> <td style="text-align:left;"> <span style=" color: white !important;padding-right: 4px; padding-left: 4px; background-color: red !important;text-align: c;">highest</span> </td> <td style="text-align:left;"> <span style=" color: black !important;padding-right: 4px; padding-left: 4px; background-color: lightgreen !important;text-align: c;">lowest</span> </td> </tr> <tr> <td style="text-align:left;"> Golden tilefish </td> <td style="text-align:left;"> <span style=" color: black !important;padding-right: 4px; padding-left: 4px; background-color: lightgreen !important;text-align: c;">lowest</span> </td> <td style="text-align:left;"> <span style=" color: black !important;padding-right: 4px; padding-left: 4px; background-color: lightgreen !important;text-align: c;">lowest</span> </td> <td style="text-align:left;"> <span style=" color: black !important;padding-right: 4px; padding-left: 4px; background-color: yellow !important;text-align: c;">lowmod</span> </td> <td style="text-align:left;"> <span style=" color: black !important;padding-right: 4px; padding-left: 4px; background-color: lightgreen !important;text-align: c;">lowest</span> </td> <td style="text-align:left;"> <span style=" color: black !important;padding-right: 4px; padding-left: 4px; background-color: lightgreen !important;text-align: c;">lowest</span> </td> <td style="text-align:left;"> <span style=" color: black !important;padding-right: 4px; padding-left: 4px; background-color: lightgreen !important;text-align: c;">lowest</span> </td> <td style="text-align:left;"> <span style=" color: black !important;padding-right: 4px; padding-left: 4px; background-color: orange !important;text-align: c;">modhigh</span> </td> <td style="text-align:left;"> <span style=" color: black !important;padding-right: 4px; padding-left: 4px; background-color: lightgreen !important;text-align: c;">lowest</span> </td> <td style="text-align:left;"> <span style=" color: black !important;padding-right: 4px; padding-left: 4px; background-color: lightgreen !important;text-align: c;">lowest</span> </td> </tr> <tr> <td style="text-align:left;"> Blueline tilefish </td> <td style="text-align:left;"> <span style=" color: white !important;padding-right: 4px; padding-left: 4px; background-color: red !important;text-align: c;">highest</span> </td> <td style="text-align:left;"> <span style=" color: white !important;padding-right: 4px; padding-left: 4px; background-color: red !important;text-align: c;">highest</span> </td> <td style="text-align:left;"> <span style=" color: black !important;padding-right: 4px; padding-left: 4px; background-color: orange !important;text-align: c;">modhigh</span> </td> <td style="text-align:left;"> <span style=" color: black !important;padding-right: 4px; padding-left: 4px; background-color: lightgreen !important;text-align: c;">lowest</span> </td> <td style="text-align:left;"> <span style=" color: black !important;padding-right: 4px; padding-left: 4px; background-color: lightgreen !important;text-align: c;">lowest</span> </td> <td style="text-align:left;"> <span style=" color: black !important;padding-right: 4px; padding-left: 4px; background-color: lightgreen !important;text-align: c;">lowest</span> </td> <td style="text-align:left;"> <span style=" color: black !important;padding-right: 4px; padding-left: 4px; background-color: orange !important;text-align: c;">modhigh</span> </td> <td style="text-align:left;"> <span style=" color: black !important;padding-right: 4px; padding-left: 4px; background-color: lightgreen !important;text-align: c;">lowest</span> </td> <td style="text-align:left;"> <span style=" color: black !important;padding-right: 4px; padding-left: 4px; background-color: lightgreen !important;text-align: c;">lowest</span> </td> </tr> <tr> <td style="text-align:left;"> Bluefish </td> <td style="text-align:left;"> <span style=" color: black !important;padding-right: 4px; padding-left: 4px; background-color: lightgreen !important;text-align: c;">lowest</span> </td> <td style="text-align:left;"> <span style=" color: black !important;padding-right: 4px; padding-left: 4px; background-color: lightgreen !important;text-align: c;">lowest</span> </td> <td style="text-align:left;"> <span style=" color: white !important;padding-right: 4px; padding-left: 4px; background-color: red !important;text-align: c;">highest</span> </td> <td style="text-align:left;"> <span style=" color: black !important;padding-right: 4px; padding-left: 4px; background-color: lightgreen !important;text-align: c;">lowest</span> </td> <td style="text-align:left;"> <span style=" color: black !important;padding-right: 4px; padding-left: 4px; background-color: lightgreen !important;text-align: c;">lowest</span> </td> <td style="text-align:left;"> <span style=" color: black !important;padding-right: 4px; padding-left: 4px; background-color: lightgreen !important;text-align: c;">lowest</span> </td> <td style="text-align:left;"> <span style=" color: black !important;padding-right: 4px; padding-left: 4px; background-color: lightgreen !important;text-align: c;">lowest</span> </td> <td style="text-align:left;"> <span style=" color: black !important;padding-right: 4px; padding-left: 4px; background-color: orange !important;text-align: c;">modhigh</span> </td> <td style="text-align:left;"> <span style=" color: white !important;padding-right: 4px; padding-left: 4px; background-color: red !important;text-align: c;">highest</span> </td> </tr> <tr> <td style="text-align:left;"> Spiny dogfish </td> <td style="text-align:left;"> <span style=" color: black !important;padding-right: 4px; padding-left: 4px; background-color: yellow !important;text-align: c;">lowmod</span> </td> <td style="text-align:left;"> <span style=" color: black !important;padding-right: 4px; padding-left: 4px; background-color: lightgreen !important;text-align: c;">lowest</span> </td> <td style="text-align:left;"> <span style=" color: black !important;padding-right: 4px; padding-left: 4px; background-color: yellow !important;text-align: c;">lowmod</span> </td> <td style="text-align:left;"> <span style=" color: black !important;padding-right: 4px; padding-left: 4px; background-color: lightgreen !important;text-align: c;">lowest</span> </td> <td style="text-align:left;"> <span style=" color: black !important;padding-right: 4px; padding-left: 4px; background-color: lightgreen !important;text-align: c;">lowest</span> </td> <td style="text-align:left;"> <span style=" color: black !important;padding-right: 4px; padding-left: 4px; background-color: lightgreen !important;text-align: c;">lowest</span> </td> <td style="text-align:left;"> <span style=" color: black !important;padding-right: 4px; padding-left: 4px; background-color: lightgreen !important;text-align: c;">lowest</span> </td> <td style="text-align:left;"> <span style=" color: white !important;padding-right: 4px; padding-left: 4px; background-color: red !important;text-align: c;">highest</span> </td> <td style="text-align:left;"> <span style=" color: black !important;padding-right: 4px; padding-left: 4px; background-color: lightgreen !important;text-align: c;">lowest</span> </td> </tr> <tr> <td style="text-align:left;"> Monkfish </td> <td style="text-align:left;"> <span style=" color: white !important;padding-right: 4px; padding-left: 4px; background-color: red !important;text-align: c;">highest</span> </td> <td style="text-align:left;"> <span style=" color: black !important;padding-right: 4px; padding-left: 4px; background-color: yellow !important;text-align: c;">lowmod</span> </td> <td style="text-align:left;"> <span style=" color: black !important;padding-right: 4px; padding-left: 4px; background-color: yellow !important;text-align: c;">lowmod</span> </td> <td style="text-align:left;"> <span style=" color: black !important;padding-right: 4px; padding-left: 4px; background-color: lightgreen !important;text-align: c;">lowest</span> </td> <td style="text-align:left;"> <span style=" color: black !important;padding-right: 4px; padding-left: 4px; background-color: lightgreen !important;text-align: c;">lowest</span> </td> <td style="text-align:left;"> <span style=" color: black !important;padding-right: 4px; padding-left: 4px; background-color: lightgreen !important;text-align: c;">lowest</span> </td> <td style="text-align:left;"> <span style=" color: black !important;padding-right: 4px; padding-left: 4px; background-color: lightgreen !important;text-align: c;">lowest</span> </td> <td style="text-align:left;"> <span style=" color: black !important;padding-right: 4px; padding-left: 4px; background-color: orange !important;text-align: c;">modhigh</span> </td> <td style="text-align:left;"> <span style=" color: black !important;padding-right: 4px; padding-left: 4px; background-color: lightgreen !important;text-align: c;">lowest</span> </td> </tr> <tr> <td style="text-align:left;"> Unmanaged forage </td> <td style="text-align:left;"> <span style=" color: black !important;padding-right: 4px; padding-left: 4px; background-color: white !important;text-align: c;">na</span> </td> <td style="text-align:left;"> <span style=" color: black !important;padding-right: 4px; padding-left: 4px; background-color: white !important;text-align: c;">na</span> </td> <td style="text-align:left;"> <span style=" color: black !important;padding-right: 4px; padding-left: 4px; background-color: white !important;text-align: c;">na</span> </td> <td style="text-align:left;"> <span style=" color: black !important;padding-right: 4px; padding-left: 4px; background-color: lightgreen !important;text-align: c;">lowest</span> </td> <td style="text-align:left;"> <span style=" color: black !important;padding-right: 4px; padding-left: 4px; background-color: yellow !important;text-align: c;">lowmod</span> </td> <td style="text-align:left;"> <span style=" color: black !important;padding-right: 4px; padding-left: 4px; background-color: yellow !important;text-align: c;">lowmod</span> </td> <td style="text-align:left;"> <span style=" color: black !important;padding-right: 4px; padding-left: 4px; background-color: white !important;text-align: c;">na</span> </td> <td style="text-align:left;"> <span style=" color: black !important;padding-right: 4px; padding-left: 4px; background-color: white !important;text-align: c;">na</span> </td> <td style="text-align:left;"> <span style=" color: black !important;padding-right: 4px; padding-left: 4px; background-color: white !important;text-align: c;">na</span> </td> </tr> <tr> <td style="text-align:left;"> Deepsea corals </td> <td style="text-align:left;"> <span style=" color: black !important;padding-right: 4px; padding-left: 4px; background-color: white !important;text-align: c;">na</span> </td> <td style="text-align:left;"> <span style=" color: black !important;padding-right: 4px; padding-left: 4px; background-color: white !important;text-align: c;">na</span> </td> <td style="text-align:left;"> <span style=" color: black !important;padding-right: 4px; padding-left: 4px; background-color: white !important;text-align: c;">na</span> </td> <td style="text-align:left;"> <span style=" color: black !important;padding-right: 4px; padding-left: 4px; background-color: lightgreen !important;text-align: c;">lowest</span> </td> <td style="text-align:left;"> <span style=" color: black !important;padding-right: 4px; padding-left: 4px; background-color: lightgreen !important;text-align: c;">lowest</span> </td> <td style="text-align:left;"> <span style=" color: black !important;padding-right: 4px; padding-left: 4px; background-color: lightgreen !important;text-align: c;">lowest</span> </td> <td style="text-align:left;"> <span style=" color: black !important;padding-right: 4px; padding-left: 4px; background-color: white !important;text-align: c;">na</span> </td> <td style="text-align:left;"> <span style=" color: black !important;padding-right: 4px; padding-left: 4px; background-color: white !important;text-align: c;">na</span> </td> <td style="text-align:left;"> <span style=" color: black !important;padding-right: 4px; padding-left: 4px; background-color: white !important;text-align: c;">na</span> </td> </tr> </tbody> </table> *Ecosystem level risk elements* <table class="risktable table" style="font-size: 9px; margin-left: auto; margin-right: auto;"> <thead> <tr> <th style="text-align:left;"> System </th> <th style="text-align:left;"> EcoProd </th> <th style="text-align:left;"> CommRev </th> <th style="text-align:left;"> RecVal </th> <th style="text-align:left;"> FishRes1 </th> <th style="text-align:left;"> FishRes4 </th> <th style="text-align:left;"> FleetDiv </th> <th style="text-align:left;"> Social </th> <th style="text-align:left;"> ComFood </th> <th style="text-align:left;"> RecFood </th> </tr> </thead> <tbody> <tr> <td style="text-align:left;"> Mid-Atlantic </td> <td style="text-align:left;"> <span style=" color: black !important;padding-right: 4px; padding-left: 4px; background-color: yellow !important;text-align: c;">lowmod</span> </td> <td style="text-align:left;"> <span style=" color: black !important;padding-right: 4px; padding-left: 4px; background-color: orange !important;text-align: c;">modhigh</span> </td> <td style="text-align:left;"> <span style=" color: white !important;padding-right: 4px; padding-left: 4px; background-color: red !important;text-align: c;">highest</span> </td> <td style="text-align:left;"> <span style=" color: black !important;padding-right: 4px; padding-left: 4px; background-color: lightgreen !important;text-align: c;">lowest</span> </td> <td style="text-align:left;"> <span style=" color: black !important;padding-right: 4px; padding-left: 4px; background-color: orange !important;text-align: c;">modhigh</span> </td> <td style="text-align:left;"> <span style=" color: black !important;padding-right: 4px; padding-left: 4px; background-color: lightgreen !important;text-align: c;">lowest</span> </td> <td style="text-align:left;"> <span style=" color: black !important;padding-right: 4px; padding-left: 4px; background-color: yellow !important;text-align: c;">lowmod</span> </td> <td style="text-align:left;"> <span style=" color: white !important;padding-right: 4px; padding-left: 4px; background-color: red !important;text-align: c;">highest</span> </td> <td style="text-align:left;"> <span style=" color: black !important;padding-right: 4px; padding-left: 4px; background-color: orange !important;text-align: c;">modhigh</span> </td> </tr> </tbody> </table> ] .pull-right[ *Species and Sector level risk elements* <table class="risktable table" style="font-size: 11px; margin-left: auto; margin-right: auto;"> <thead> <tr> <th style="text-align:left;"> Species </th> <th style="text-align:left;"> MgtControl </th> <th style="text-align:left;"> TecInteract </th> <th style="text-align:left;"> OceanUse </th> <th style="text-align:left;"> RegComplex </th> <th style="text-align:left;"> Discards </th> <th style="text-align:left;"> Allocation </th> </tr> </thead> <tbody> <tr> <td style="text-align:left;"> Ocean Quahog-C </td> <td style="text-align:left;"> <span style=" color: black !important;padding-right: 4px; padding-left: 4px; background-color: lightgreen !important;text-align: c;">lowest</span> </td> <td style="text-align:left;"> <span style=" color: black !important;padding-right: 4px; padding-left: 4px; background-color: lightgreen !important;text-align: c;">lowest</span> </td> <td style="text-align:left;"> <span style=" color: black !important;padding-right: 4px; padding-left: 4px; background-color: yellow !important;text-align: c;">lowmod</span> </td> <td style="text-align:left;"> <span style=" color: black !important;padding-right: 4px; padding-left: 4px; background-color: lightgreen !important;text-align: c;">lowest</span> </td> <td style="text-align:left;"> <span style=" color: black !important;padding-right: 4px; padding-left: 4px; background-color: orange !important;text-align: c;">modhigh</span> </td> <td style="text-align:left;"> <span style=" color: black !important;padding-right: 4px; padding-left: 4px; background-color: lightgreen !important;text-align: c;">lowest</span> </td> </tr> <tr> <td style="text-align:left;"> Surfclam-C </td> <td style="text-align:left;"> <span style=" color: black !important;padding-right: 4px; padding-left: 4px; background-color: lightgreen !important;text-align: c;">lowest</span> </td> <td style="text-align:left;"> <span style=" color: black !important;padding-right: 4px; padding-left: 4px; background-color: lightgreen !important;text-align: c;">lowest</span> </td> <td style="text-align:left;"> <span style=" color: black !important;padding-right: 4px; padding-left: 4px; background-color: yellow !important;text-align: c;">lowmod</span> </td> <td style="text-align:left;"> <span style=" color: black !important;padding-right: 4px; padding-left: 4px; background-color: lightgreen !important;text-align: c;">lowest</span> </td> <td style="text-align:left;"> <span style=" color: black !important;padding-right: 4px; padding-left: 4px; background-color: orange !important;text-align: c;">modhigh</span> </td> <td style="text-align:left;"> <span style=" color: black !important;padding-right: 4px; padding-left: 4px; background-color: lightgreen !important;text-align: c;">lowest</span> </td> </tr> <tr> <td style="text-align:left;"> Summer flounder-R </td> <td style="text-align:left;"> <span style=" color: black !important;padding-right: 4px; padding-left: 4px; background-color: orange !important;text-align: c;">modhigh</span> </td> <td style="text-align:left;"> <span style=" color: black !important;padding-right: 4px; padding-left: 4px; background-color: lightgreen !important;text-align: c;">lowest</span> </td> <td style="text-align:left;"> <span style=" color: black !important;padding-right: 4px; padding-left: 4px; background-color: yellow !important;text-align: c;">lowmod</span> </td> <td style="text-align:left;"> <span style=" color: black !important;padding-right: 4px; padding-left: 4px; background-color: orange !important;text-align: c;">modhigh</span> </td> <td style="text-align:left;"> <span style=" color: white !important;padding-right: 4px; padding-left: 4px; background-color: red !important;text-align: c;">highest</span> </td> <td style="text-align:left;"> <span style=" color: white !important;padding-right: 4px; padding-left: 4px; background-color: red !important;text-align: c;">highest</span> </td> </tr> <tr> <td style="text-align:left;"> Summer flounder-C </td> <td style="text-align:left;"> <span style=" color: black !important;padding-right: 4px; padding-left: 4px; background-color: yellow !important;text-align: c;">lowmod</span> </td> <td style="text-align:left;"> <span style=" color: black !important;padding-right: 4px; padding-left: 4px; background-color: orange !important;text-align: c;">modhigh</span> </td> <td style="text-align:left;"> <span style=" color: black !important;padding-right: 4px; padding-left: 4px; background-color: yellow !important;text-align: c;">lowmod</span> </td> <td style="text-align:left;"> <span style=" color: black !important;padding-right: 4px; padding-left: 4px; background-color: orange !important;text-align: c;">modhigh</span> </td> <td style="text-align:left;"> <span style=" color: black !important;padding-right: 4px; padding-left: 4px; background-color: orange !important;text-align: c;">modhigh</span> </td> <td style="text-align:left;"> <span style=" color: white !important;padding-right: 4px; padding-left: 4px; background-color: red !important;text-align: c;">highest</span> </td> </tr> <tr> <td style="text-align:left;"> Scup-R </td> <td style="text-align:left;"> <span style=" color: black !important;padding-right: 4px; padding-left: 4px; background-color: yellow !important;text-align: c;">lowmod</span> </td> <td style="text-align:left;"> <span style=" color: black !important;padding-right: 4px; padding-left: 4px; background-color: lightgreen !important;text-align: c;">lowest</span> </td> <td style="text-align:left;"> <span style=" color: black !important;padding-right: 4px; padding-left: 4px; background-color: yellow !important;text-align: c;">lowmod</span> </td> <td style="text-align:left;"> <span style=" color: black !important;padding-right: 4px; padding-left: 4px; background-color: orange !important;text-align: c;">modhigh</span> </td> <td style="text-align:left;"> <span style=" color: black !important;padding-right: 4px; padding-left: 4px; background-color: orange !important;text-align: c;">modhigh</span> </td> <td style="text-align:left;"> <span style=" color: white !important;padding-right: 4px; padding-left: 4px; background-color: red !important;text-align: c;">highest</span> </td> </tr> <tr> <td style="text-align:left;"> Scup-C </td> <td style="text-align:left;"> <span style=" color: black !important;padding-right: 4px; padding-left: 4px; background-color: lightgreen !important;text-align: c;">lowest</span> </td> <td style="text-align:left;"> <span style=" color: black !important;padding-right: 4px; padding-left: 4px; background-color: yellow !important;text-align: c;">lowmod</span> </td> <td style="text-align:left;"> <span style=" color: black !important;padding-right: 4px; padding-left: 4px; background-color: orange !important;text-align: c;">modhigh</span> </td> <td style="text-align:left;"> <span style=" color: black !important;padding-right: 4px; padding-left: 4px; background-color: orange !important;text-align: c;">modhigh</span> </td> <td style="text-align:left;"> <span style=" color: black !important;padding-right: 4px; padding-left: 4px; background-color: orange !important;text-align: c;">modhigh</span> </td> <td style="text-align:left;"> <span style=" color: white !important;padding-right: 4px; padding-left: 4px; background-color: red !important;text-align: c;">highest</span> </td> </tr> <tr> <td style="text-align:left;"> Black sea bass-R </td> <td style="text-align:left;"> <span style=" color: white !important;padding-right: 4px; padding-left: 4px; background-color: red !important;text-align: c;">highest</span> </td> <td style="text-align:left;"> <span style=" color: black !important;padding-right: 4px; padding-left: 4px; background-color: lightgreen !important;text-align: c;">lowest</span> </td> <td style="text-align:left;"> <span style=" color: black !important;padding-right: 4px; padding-left: 4px; background-color: orange !important;text-align: c;">modhigh</span> </td> <td style="text-align:left;"> <span style=" color: white !important;padding-right: 4px; padding-left: 4px; background-color: red !important;text-align: c;">highest</span> </td> <td style="text-align:left;"> <span style=" color: white !important;padding-right: 4px; padding-left: 4px; background-color: red !important;text-align: c;">highest</span> </td> <td style="text-align:left;"> <span style=" color: white !important;padding-right: 4px; padding-left: 4px; background-color: red !important;text-align: c;">highest</span> </td> </tr> <tr> <td style="text-align:left;"> Black sea bass-C </td> <td style="text-align:left;"> <span style=" color: white !important;padding-right: 4px; padding-left: 4px; background-color: red !important;text-align: c;">highest</span> </td> <td style="text-align:left;"> <span style=" color: black !important;padding-right: 4px; padding-left: 4px; background-color: yellow !important;text-align: c;">lowmod</span> </td> <td style="text-align:left;"> <span style=" color: white !important;padding-right: 4px; padding-left: 4px; background-color: red !important;text-align: c;">highest</span> </td> <td style="text-align:left;"> <span style=" color: black !important;padding-right: 4px; padding-left: 4px; background-color: orange !important;text-align: c;">modhigh</span> </td> <td style="text-align:left;"> <span style=" color: white !important;padding-right: 4px; padding-left: 4px; background-color: red !important;text-align: c;">highest</span> </td> <td style="text-align:left;"> <span style=" color: white !important;padding-right: 4px; padding-left: 4px; background-color: red !important;text-align: c;">highest</span> </td> </tr> <tr> <td style="text-align:left;"> Atl. mackerel-R </td> <td style="text-align:left;"> <span style=" color: black !important;padding-right: 4px; padding-left: 4px; background-color: yellow !important;text-align: c;">lowmod</span> </td> <td style="text-align:left;"> <span style=" color: black !important;padding-right: 4px; padding-left: 4px; background-color: lightgreen !important;text-align: c;">lowest</span> </td> <td style="text-align:left;"> <span style=" color: black !important;padding-right: 4px; padding-left: 4px; background-color: lightgreen !important;text-align: c;">lowest</span> </td> <td style="text-align:left;"> <span style=" color: black !important;padding-right: 4px; padding-left: 4px; background-color: lightgreen !important;text-align: c;">lowest</span> </td> <td style="text-align:left;"> <span style=" color: black !important;padding-right: 4px; padding-left: 4px; background-color: lightgreen !important;text-align: c;">lowest</span> </td> <td style="text-align:left;"> <span style=" color: black !important;padding-right: 4px; padding-left: 4px; background-color: yellow !important;text-align: c;">lowmod</span> </td> </tr> <tr> <td style="text-align:left;"> Atl. mackerel-C </td> <td style="text-align:left;"> <span style=" color: black !important;padding-right: 4px; padding-left: 4px; background-color: lightgreen !important;text-align: c;">lowest</span> </td> <td style="text-align:left;"> <span style=" color: black !important;padding-right: 4px; padding-left: 4px; background-color: yellow !important;text-align: c;">lowmod</span> </td> <td style="text-align:left;"> <span style=" color: black !important;padding-right: 4px; padding-left: 4px; background-color: orange !important;text-align: c;">modhigh</span> </td> <td style="text-align:left;"> <span style=" color: white !important;padding-right: 4px; padding-left: 4px; background-color: red !important;text-align: c;">highest</span> </td> <td style="text-align:left;"> <span style=" color: black !important;padding-right: 4px; padding-left: 4px; background-color: yellow !important;text-align: c;">lowmod</span> </td> <td style="text-align:left;"> <span style=" color: white !important;padding-right: 4px; padding-left: 4px; background-color: red !important;text-align: c;">highest</span> </td> </tr> <tr> <td style="text-align:left;"> Butterfish-C </td> <td style="text-align:left;"> <span style=" color: black !important;padding-right: 4px; padding-left: 4px; background-color: lightgreen !important;text-align: c;">lowest</span> </td> <td style="text-align:left;"> <span style=" color: black !important;padding-right: 4px; padding-left: 4px; background-color: yellow !important;text-align: c;">lowmod</span> </td> <td style="text-align:left;"> <span style=" color: black !important;padding-right: 4px; padding-left: 4px; background-color: orange !important;text-align: c;">modhigh</span> </td> <td style="text-align:left;"> <span style=" color: white !important;padding-right: 4px; padding-left: 4px; background-color: red !important;text-align: c;">highest</span> </td> <td style="text-align:left;"> <span style=" color: black !important;padding-right: 4px; padding-left: 4px; background-color: orange !important;text-align: c;">modhigh</span> </td> <td style="text-align:left;"> <span style=" color: black !important;padding-right: 4px; padding-left: 4px; background-color: lightgreen !important;text-align: c;">lowest</span> </td> </tr> <tr> <td style="text-align:left;"> Longfin squid-C </td> <td style="text-align:left;"> <span style=" color: black !important;padding-right: 4px; padding-left: 4px; background-color: lightgreen !important;text-align: c;">lowest</span> </td> <td style="text-align:left;"> <span style=" color: black !important;padding-right: 4px; padding-left: 4px; background-color: orange !important;text-align: c;">modhigh</span> </td> <td style="text-align:left;"> <span style=" color: white !important;padding-right: 4px; padding-left: 4px; background-color: red !important;text-align: c;">highest</span> </td> <td style="text-align:left;"> <span style=" color: white !important;padding-right: 4px; padding-left: 4px; background-color: red !important;text-align: c;">highest</span> </td> <td style="text-align:left;"> <span style=" color: white !important;padding-right: 4px; padding-left: 4px; background-color: red !important;text-align: c;">highest</span> </td> <td style="text-align:left;"> <span style=" color: black !important;padding-right: 4px; padding-left: 4px; background-color: yellow !important;text-align: c;">lowmod</span> </td> </tr> <tr> <td style="text-align:left;"> Shortfin squid-C </td> <td style="text-align:left;"> <span style=" color: black !important;padding-right: 4px; padding-left: 4px; background-color: yellow !important;text-align: c;">lowmod</span> </td> <td style="text-align:left;"> <span style=" color: black !important;padding-right: 4px; padding-left: 4px; background-color: yellow !important;text-align: c;">lowmod</span> </td> <td style="text-align:left;"> <span style=" color: black !important;padding-right: 4px; padding-left: 4px; background-color: yellow !important;text-align: c;">lowmod</span> </td> <td style="text-align:left;"> <span style=" color: black !important;padding-right: 4px; padding-left: 4px; background-color: yellow !important;text-align: c;">lowmod</span> </td> <td style="text-align:left;"> <span style=" color: black !important;padding-right: 4px; padding-left: 4px; background-color: lightgreen !important;text-align: c;">lowest</span> </td> <td style="text-align:left;"> <span style=" color: white !important;padding-right: 4px; padding-left: 4px; background-color: red !important;text-align: c;">highest</span> </td> </tr> <tr> <td style="text-align:left;"> Golden tilefish-R </td> <td style="text-align:left;"> <span style=" color: black !important;padding-right: 4px; padding-left: 4px; background-color: white !important;text-align: c;">na</span> </td> <td style="text-align:left;"> <span style=" color: black !important;padding-right: 4px; padding-left: 4px; background-color: lightgreen !important;text-align: c;">lowest</span> </td> <td style="text-align:left;"> <span style=" color: black !important;padding-right: 4px; padding-left: 4px; background-color: lightgreen !important;text-align: c;">lowest</span> </td> <td style="text-align:left;"> <span style=" color: black !important;padding-right: 4px; padding-left: 4px; background-color: lightgreen !important;text-align: c;">lowest</span> </td> <td style="text-align:left;"> <span style=" color: black !important;padding-right: 4px; padding-left: 4px; background-color: lightgreen !important;text-align: c;">lowest</span> </td> <td style="text-align:left;"> <span style=" color: black !important;padding-right: 4px; padding-left: 4px; background-color: lightgreen !important;text-align: c;">lowest</span> </td> </tr> <tr> <td style="text-align:left;"> Golden tilefish-C </td> <td style="text-align:left;"> <span style=" color: black !important;padding-right: 4px; padding-left: 4px; background-color: lightgreen !important;text-align: c;">lowest</span> </td> <td style="text-align:left;"> <span style=" color: black !important;padding-right: 4px; padding-left: 4px; background-color: lightgreen !important;text-align: c;">lowest</span> </td> <td style="text-align:left;"> <span style=" color: black !important;padding-right: 4px; padding-left: 4px; background-color: lightgreen !important;text-align: c;">lowest</span> </td> <td style="text-align:left;"> <span style=" color: black !important;padding-right: 4px; padding-left: 4px; background-color: lightgreen !important;text-align: c;">lowest</span> </td> <td style="text-align:left;"> <span style=" color: black !important;padding-right: 4px; padding-left: 4px; background-color: lightgreen !important;text-align: c;">lowest</span> </td> <td style="text-align:left;"> <span style=" color: black !important;padding-right: 4px; padding-left: 4px; background-color: lightgreen !important;text-align: c;">lowest</span> </td> </tr> <tr> <td style="text-align:left;"> Blueline tilefish-R </td> <td style="text-align:left;"> <span style=" color: black !important;padding-right: 4px; padding-left: 4px; background-color: lightgreen !important;text-align: c;">lowest</span> </td> <td style="text-align:left;"> <span style=" color: black !important;padding-right: 4px; padding-left: 4px; background-color: lightgreen !important;text-align: c;">lowest</span> </td> <td style="text-align:left;"> <span style=" color: black !important;padding-right: 4px; padding-left: 4px; background-color: lightgreen !important;text-align: c;">lowest</span> </td> <td style="text-align:left;"> <span style=" color: black !important;padding-right: 4px; padding-left: 4px; background-color: orange !important;text-align: c;">modhigh</span> </td> <td style="text-align:left;"> <span style=" color: black !important;padding-right: 4px; padding-left: 4px; background-color: lightgreen !important;text-align: c;">lowest</span> </td> <td style="text-align:left;"> <span style=" color: white !important;padding-right: 4px; padding-left: 4px; background-color: red !important;text-align: c;">highest</span> </td> </tr> <tr> <td style="text-align:left;"> Blueline tilefish-C </td> <td style="text-align:left;"> <span style=" color: black !important;padding-right: 4px; padding-left: 4px; background-color: lightgreen !important;text-align: c;">lowest</span> </td> <td style="text-align:left;"> <span style=" color: black !important;padding-right: 4px; padding-left: 4px; background-color: lightgreen !important;text-align: c;">lowest</span> </td> <td style="text-align:left;"> <span style=" color: black !important;padding-right: 4px; padding-left: 4px; background-color: lightgreen !important;text-align: c;">lowest</span> </td> <td style="text-align:left;"> <span style=" color: black !important;padding-right: 4px; padding-left: 4px; background-color: orange !important;text-align: c;">modhigh</span> </td> <td style="text-align:left;"> <span style=" color: black !important;padding-right: 4px; padding-left: 4px; background-color: lightgreen !important;text-align: c;">lowest</span> </td> <td style="text-align:left;"> <span style=" color: white !important;padding-right: 4px; padding-left: 4px; background-color: red !important;text-align: c;">highest</span> </td> </tr> <tr> <td style="text-align:left;"> Bluefish-R </td> <td style="text-align:left;"> <span style=" color: black !important;padding-right: 4px; padding-left: 4px; background-color: yellow !important;text-align: c;">lowmod</span> </td> <td style="text-align:left;"> <span style=" color: black !important;padding-right: 4px; padding-left: 4px; background-color: lightgreen !important;text-align: c;">lowest</span> </td> <td style="text-align:left;"> <span style=" color: black !important;padding-right: 4px; padding-left: 4px; background-color: lightgreen !important;text-align: c;">lowest</span> </td> <td style="text-align:left;"> <span style=" color: black !important;padding-right: 4px; padding-left: 4px; background-color: yellow !important;text-align: c;">lowmod</span> </td> <td style="text-align:left;"> <span style=" color: black !important;padding-right: 4px; padding-left: 4px; background-color: orange !important;text-align: c;">modhigh</span> </td> <td style="text-align:left;"> <span style=" color: white !important;padding-right: 4px; padding-left: 4px; background-color: red !important;text-align: c;">highest</span> </td> </tr> <tr> <td style="text-align:left;"> Bluefish-C </td> <td style="text-align:left;"> <span style=" color: black !important;padding-right: 4px; padding-left: 4px; background-color: lightgreen !important;text-align: c;">lowest</span> </td> <td style="text-align:left;"> <span style=" color: black !important;padding-right: 4px; padding-left: 4px; background-color: lightgreen !important;text-align: c;">lowest</span> </td> <td style="text-align:left;"> <span style=" color: black !important;padding-right: 4px; padding-left: 4px; background-color: yellow !important;text-align: c;">lowmod</span> </td> <td style="text-align:left;"> <span style=" color: black !important;padding-right: 4px; padding-left: 4px; background-color: yellow !important;text-align: c;">lowmod</span> </td> <td style="text-align:left;"> <span style=" color: black !important;padding-right: 4px; padding-left: 4px; background-color: yellow !important;text-align: c;">lowmod</span> </td> <td style="text-align:left;"> <span style=" color: white !important;padding-right: 4px; padding-left: 4px; background-color: red !important;text-align: c;">highest</span> </td> </tr> <tr> <td style="text-align:left;"> Spiny dogfish-R </td> <td style="text-align:left;"> <span style=" color: black !important;padding-right: 4px; padding-left: 4px; background-color: lightgreen !important;text-align: c;">lowest</span> </td> <td style="text-align:left;"> <span style=" color: black !important;padding-right: 4px; padding-left: 4px; background-color: lightgreen !important;text-align: c;">lowest</span> </td> <td style="text-align:left;"> <span style=" color: black !important;padding-right: 4px; padding-left: 4px; background-color: lightgreen !important;text-align: c;">lowest</span> </td> <td style="text-align:left;"> <span style=" color: black !important;padding-right: 4px; padding-left: 4px; background-color: lightgreen !important;text-align: c;">lowest</span> </td> <td style="text-align:left;"> <span style=" color: black !important;padding-right: 4px; padding-left: 4px; background-color: lightgreen !important;text-align: c;">lowest</span> </td> <td style="text-align:left;"> <span style=" color: black !important;padding-right: 4px; padding-left: 4px; background-color: lightgreen !important;text-align: c;">lowest</span> </td> </tr> <tr> <td style="text-align:left;"> Spiny dogfish-C </td> <td style="text-align:left;"> <span style=" color: black !important;padding-right: 4px; padding-left: 4px; background-color: lightgreen !important;text-align: c;">lowest</span> </td> <td style="text-align:left;"> <span style=" color: black !important;padding-right: 4px; padding-left: 4px; background-color: orange !important;text-align: c;">modhigh</span> </td> <td style="text-align:left;"> <span style=" color: black !important;padding-right: 4px; padding-left: 4px; background-color: orange !important;text-align: c;">modhigh</span> </td> <td style="text-align:left;"> <span style=" color: black !important;padding-right: 4px; padding-left: 4px; background-color: orange !important;text-align: c;">modhigh</span> </td> <td style="text-align:left;"> <span style=" color: black !important;padding-right: 4px; padding-left: 4px; background-color: yellow !important;text-align: c;">lowmod</span> </td> <td style="text-align:left;"> <span style=" color: black !important;padding-right: 4px; padding-left: 4px; background-color: orange !important;text-align: c;">modhigh</span> </td> </tr> <tr> <td style="text-align:left;"> Chub mackerel-C </td> <td style="text-align:left;"> <span style=" color: black !important;padding-right: 4px; padding-left: 4px; background-color: lightgreen !important;text-align: c;">lowest</span> </td> <td style="text-align:left;"> <span style=" color: black !important;padding-right: 4px; padding-left: 4px; background-color: yellow !important;text-align: c;">lowmod</span> </td> <td style="text-align:left;"> <span style=" color: black !important;padding-right: 4px; padding-left: 4px; background-color: yellow !important;text-align: c;">lowmod</span> </td> <td style="text-align:left;"> <span style=" color: black !important;padding-right: 4px; padding-left: 4px; background-color: yellow !important;text-align: c;">lowmod</span> </td> <td style="text-align:left;"> <span style=" color: black !important;padding-right: 4px; padding-left: 4px; background-color: lightgreen !important;text-align: c;">lowest</span> </td> <td style="text-align:left;"> <span style=" color: black !important;padding-right: 4px; padding-left: 4px; background-color: lightgreen !important;text-align: c;">lowest</span> </td> </tr> <tr> <td style="text-align:left;"> Unmanaged forage </td> <td style="text-align:left;"> <span style=" color: black !important;padding-right: 4px; padding-left: 4px; background-color: lightgreen !important;text-align: c;">lowest</span> </td> <td style="text-align:left;"> <span style=" color: black !important;padding-right: 4px; padding-left: 4px; background-color: lightgreen !important;text-align: c;">lowest</span> </td> <td style="text-align:left;"> <span style=" color: black !important;padding-right: 4px; padding-left: 4px; background-color: orange !important;text-align: c;">modhigh</span> </td> <td style="text-align:left;"> <span style=" color: black !important;padding-right: 4px; padding-left: 4px; background-color: lightgreen !important;text-align: c;">lowest</span> </td> <td style="text-align:left;"> <span style=" color: black !important;padding-right: 4px; padding-left: 4px; background-color: lightgreen !important;text-align: c;">lowest</span> </td> <td style="text-align:left;"> <span style=" color: black !important;padding-right: 4px; padding-left: 4px; background-color: lightgreen !important;text-align: c;">lowest</span> </td> </tr> <tr> <td style="text-align:left;"> Deepsea corals </td> <td style="text-align:left;"> <span style=" color: black !important;padding-right: 4px; padding-left: 4px; background-color: white !important;text-align: c;">na</span> </td> <td style="text-align:left;"> <span style=" color: black !important;padding-right: 4px; padding-left: 4px; background-color: white !important;text-align: c;">na</span> </td> <td style="text-align:left;"> <span style=" color: black !important;padding-right: 4px; padding-left: 4px; background-color: orange !important;text-align: c;">modhigh</span> </td> <td style="text-align:left;"> <span style=" color: black !important;padding-right: 4px; padding-left: 4px; background-color: white !important;text-align: c;">na</span> </td> <td style="text-align:left;"> <span style=" color: black !important;padding-right: 4px; padding-left: 4px; background-color: white !important;text-align: c;">na</span> </td> <td style="text-align:left;"> <span style=" color: black !important;padding-right: 4px; padding-left: 4px; background-color: white !important;text-align: c;">na</span> </td> </tr> </tbody> </table> ] --- ## Future: Better integration of estuarine-nearshore habitats with offshore for managers * Mid-Atlantic Council very interested in estuarine conditions and habitat supporting managed stocks * Chesapeake Bay has excellent indicators and synthesis * Prioritize next steps for identifying high risk combinations: Key species, habitats, and drivers * 2021 SOE introduces Habitat Climate Vulerability Assessment results linked to species ``` ## [1] TRUE ``` <div id="htmlwidget-4e8046a278861ac5128a" style="width:100%;height:504px;" class="widgetframe html-widget"></div> <script type="application/json" data-for="htmlwidget-4e8046a278861ac5128a">{"x":{"url":"20210114_ChesapeakeFishGIT_Gaichas_files/figure-html//widgets/widget_midHabTable.html","options":{"xdomain":"*","allowfullscreen":false,"lazyload":false}},"evals":[],"jsHooks":[]}</script> --- ## References .contrib[ <a name=bib-bastille_improving_2020></a>[Bastille, K. et al.](#cite-bastille_improving_2020) (2020). "Improving the IEA Approach Using Principles of Open Data Science". In: _Coastal Management_ 0.0. Publisher: Taylor & Francis \_ eprint: https://doi.org/10.1080/08920753.2021.1846155, pp. 1-18. ISSN: 0892-0753. DOI: [10.1080/08920753.2021.1846155](https://doi.org/10.1080%2F08920753.2021.1846155). URL: [https://doi.org/10.1080/08920753.2021.1846155](https://doi.org/10.1080/08920753.2021.1846155) (visited on Dec. 09, 2020). <a name=bib-depiper_operationalizing_2017></a>[DePiper, G. S. et al.](#cite-depiper_operationalizing_2017) (2017). "Operationalizing integrated ecosystem assessments within a multidisciplinary team: lessons learned from a worked example". En. In: _ICES Journal of Marine Science_ 74.8, pp. 2076-2086. ISSN: 1054-3139. DOI: [10.1093/icesjms/fsx038](https://doi.org/10.1093%2Ficesjms%2Ffsx038). URL: [https://academic.oup.com/icesjms/article/74/8/2076/3094701](https://academic.oup.com/icesjms/article/74/8/2076/3094701) (visited on Mar. 09, 2018). <a name=bib-gaichas_implementing_2018></a>[Gaichas, S. K. et al.](#cite-gaichas_implementing_2018) (2018). "Implementing Ecosystem Approaches to Fishery Management: Risk Assessment in the US Mid-Atlantic". In: _Frontiers in Marine Science_ 5. ISSN: 2296-7745. DOI: [10.3389/fmars.2018.00442](https://doi.org/10.3389%2Ffmars.2018.00442). URL: [https://www.frontiersin.org/articles/10.3389/fmars.2018.00442/abstract](https://www.frontiersin.org/articles/10.3389/fmars.2018.00442/abstract) (visited on Nov. 20, 2018). <a name=bib-gaichas_framework_2016></a>[Gaichas, S. K. et al.](#cite-gaichas_framework_2016) (2016). "A Framework for Incorporating Species, Fleet, Habitat, and Climate Interactions into Fishery Management". In: _Frontiers in Marine Science_ 3. ISSN: 2296-7745. DOI: [10.3389/fmars.2016.00105](https://doi.org/10.3389%2Ffmars.2016.00105). URL: [https://www.frontiersin.org/articles/10.3389/fmars.2016.00105/full](https://www.frontiersin.org/articles/10.3389/fmars.2016.00105/full) (visited on Apr. 29, 2020). <a name=bib-muffley_there_2020></a>[Muffley, B. et al.](#cite-muffley_there_2020) (2020). "There Is no I in EAFM Adapting Integrated Ecosystem Assessment for Mid-Atlantic Fisheries Management". In: _Coastal Management_ 0.0. Publisher: Taylor & Francis \_ eprint: https://doi.org/10.1080/08920753.2021.1846156, pp. 1-17. ISSN: 0892-0753. DOI: [10.1080/08920753.2021.1846156](https://doi.org/10.1080%2F08920753.2021.1846156). URL: [https://doi.org/10.1080/08920753.2021.1846156](https://doi.org/10.1080/08920753.2021.1846156) (visited on Dec. 09, 2020). ] ## Additional resources .pull-left[ * [SOE Technical Documentation](https://noaa-edab.github.io/tech-doc) * [ecodata R package](https://github.com/noaa-edab/ecodata) * [Macrofauna indicators](http://noaa-edab.github.io/ecodata/macrofauna) * [Human Dimensions indicators](http://noaa-edab.github.io/ecodata/human_dimensions) * [Lower trophic level indicators](http://noaa-edab.github.io/ecodata/LTL) ] .pull-right[ * [Mid-Atlantic ecosystem approach](https://www.mafmc.org/eafm) * [State of the Ecosystem Reports](https://www.fisheries.noaa.gov/new-england-mid-atlantic/ecosystems/state-ecosystem-reports-northeast-us-shelf) * [Draft indicator catalogue](https://noaa-edab.github.io/catalog/) .contrib[ * Slides available at https://noaa-edab.github.io/presentations * Contact: <Sarah.Gaichas@noaa.gov> ] ] --- ## Methods: Risk assessent indicators and ranking criteria, Commercial revenue example .pull-left[ This element is applied at the ecosystem level. Revenue serves as a proxy for commercial profits. .table[ | Risk Level | Definition | |:-------------------|:--------------------------------------------------------------------| | Low | No trend and low variability in revenue | | Low-Moderate | Increasing or high variability in revenue | | Moderate-High | Significant long term revenue decrease | | High | Significant recent decrease in revenue | ] *Ranked moderate-high risk due to the significant long term revenue decrease for Mid-Atlantic managed species (red points in top plot)* ] .pull-right[ <div class="figure"> <img src="20210114_ChesapeakeFishGIT_Gaichas_files/figure-html/total-rev-1.png" alt="Total revenue for the region (black) and revenue from MAFMC managed species (red)." width="360" /> <p class="caption">Total revenue for the region (black) and revenue from MAFMC managed species (red).</p> </div> <div class="figure"> <img src="20210114_ChesapeakeFishGIT_Gaichas_files/figure-html/bennet-1.png" alt="Revenue change from the 2015 base year in 2015 dollars (black), Price (PI), and Volume Indicators (VI) for commercial landings in the Mid-Atlantic." width="360" /> <p class="caption">Revenue change from the 2015 base year in 2015 dollars (black), Price (PI), and Volume Indicators (VI) for commercial landings in the Mid-Atlantic.</p> </div> ] --- ## Methods: Synthesis analysis refinements for SSC and Council decisions? Example .pull-left[  ] .pull-right[  ] Conceptual model links indicators in the report with management objectives. A subset of objectives are currently under investigation using GAMs and hedonic price functions. We plan to extend this work with structural equation modeling and or other methods in 2020.