class: right, middle, my-title, title-slide # US Fishery Management Update ## EAFM and EBFM progress with <br /> Fisheries Management Councils ### Sarah Gaichas, Geret DePiper, Brandon Muffley, Richard Seagraves, Sean Lucey <br /> Northeast Fisheries Science Center, Mid-Atlantic Fishery Management Council --- class: top, left ## Fishery management in the US Eight regional Fishery Management Councils establish plans for sustainable management of stocks within their jurisdictions. All are governed by the same law, but tailor management to their regional stakeholder needs. 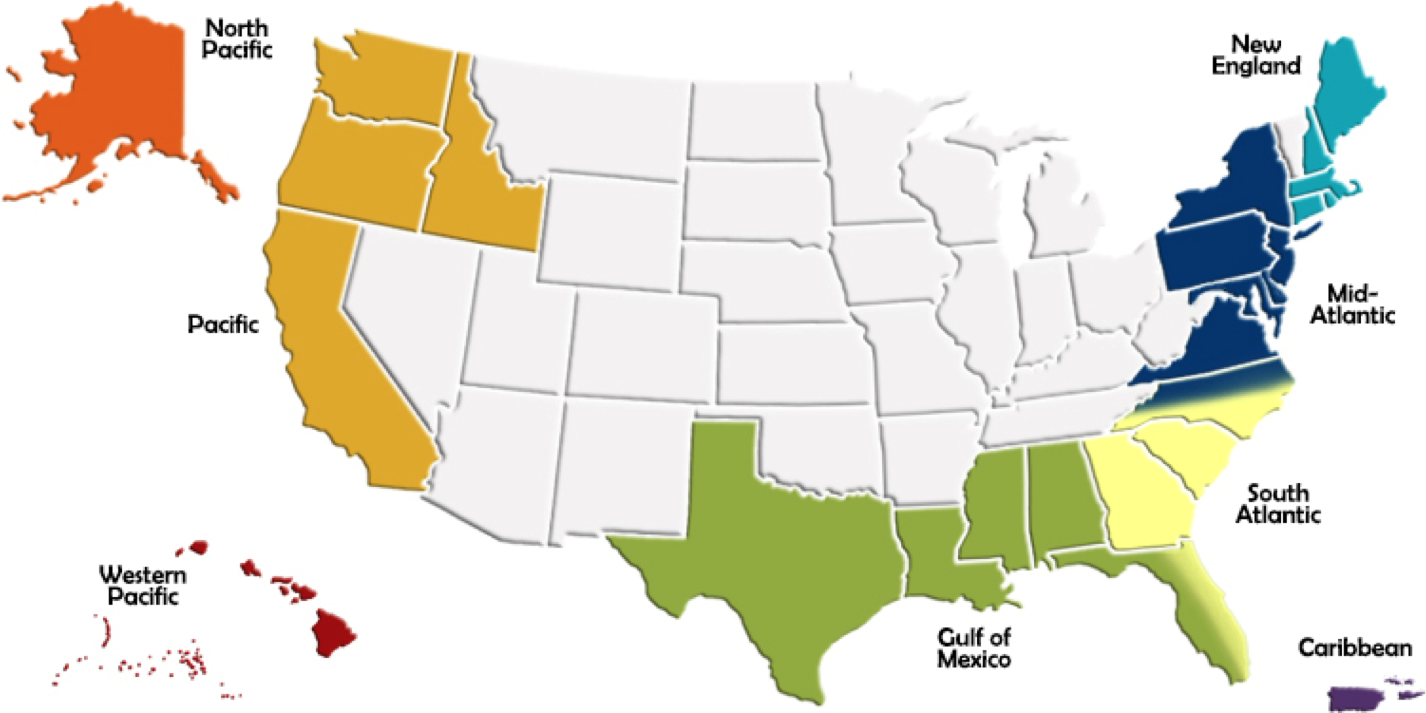 More information: http://www.fisherycouncils.org/ https://www.fisheries.noaa.gov/topic/laws-policies#magnuson-stevens-act --- ## The Mid-Atlantic Fishery Management Council (MAFMC) .pull-left-30[ 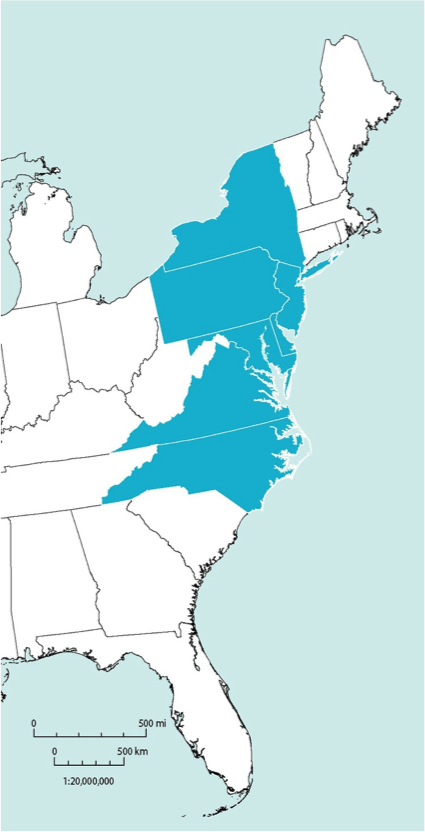 ] .pull-right-70[ 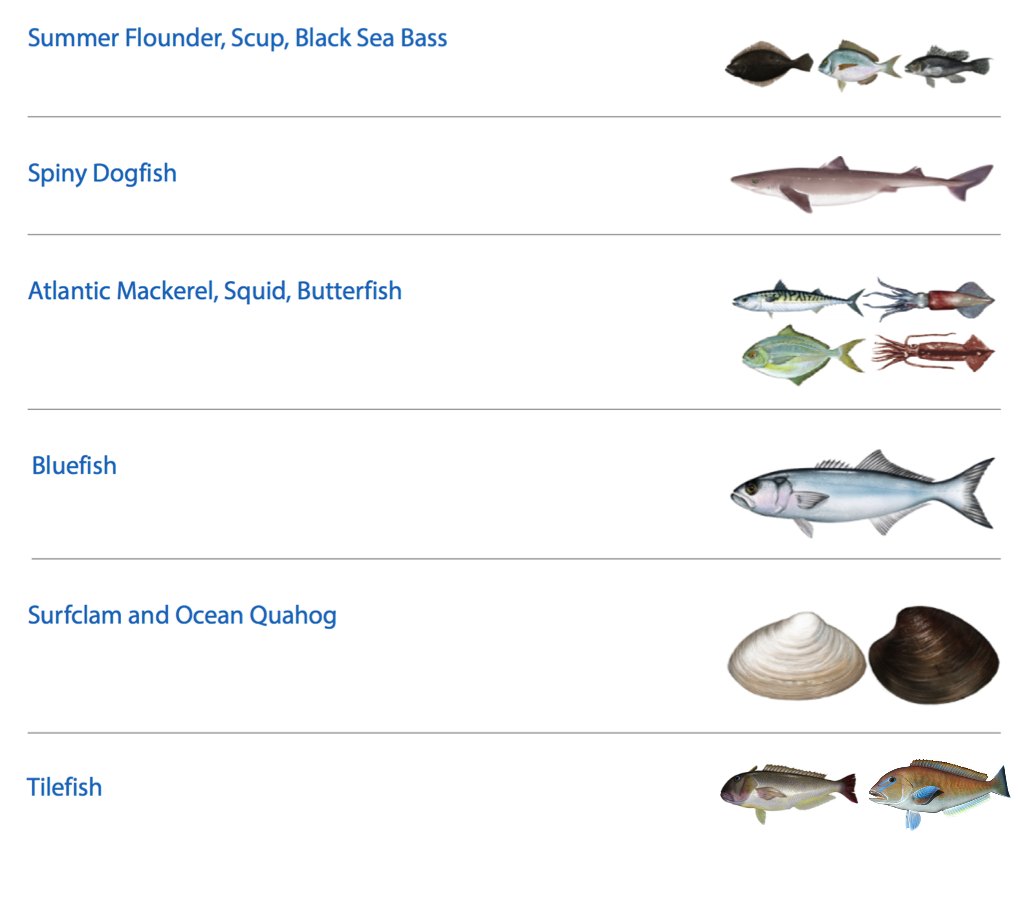 ] Source: http://www.mafmc.org/fishery-management-plans --- ## An integrated ecosystem assessment success story (in progress) Diverse stakeholders agreed that an ecosystem approach was necessary. Developing and implementing an ecosystem approach to fishery management was done in collaboration between managers, stakeholders, and scientists. .pull-left[ *Outline* - Mid-Atlantic Fishery Management Council Ecosystem Approach (EAFM) - Mid-Atlantic EAFM indicator-based risk assessment - Mid-Atlantic EAFM conceptual modeling (towards MSE) ] .pull-right[ *Integrated Ecosystem Assessment*  .image-cap[ https://www.integratedecosystemassessment.noaa.gov/national/IEA-approach ] ] ??? --- ## Mid-Atlantic Council Ecosystem Approach * 2016 Ecosystem Approach to Fishery Management (EAFM) Policy Guidance document: http://www.mafmc.org/s/EAFM-Doc-Revised-2019-02-08.pdf * Mid-Atlantic EAFM framework<sup>1</sup>: .center[  ] https://www.frontiersin.org/articles/10.3389/fmars.2016.00105/full .footnote[ [1] Gaichas, S., Seagraves, R., Coakley, J., DePiper, G., Guida, V., Hare, J., Rago, P., et al. 2016. A Framework for Incorporating Species, Fleet, Habitat, and Climate Interactions into Fishery Management. Frontiers in Marine Science, 3. ] ??? The Council’s EAFM framework has similarities to the IEA loop on slide 2. It uses risk assessment as a first step to prioritize combinations of managed species, fleets, and ecosystem interactions for consideration. Second, a conceptual model is developed identifying key environmental, ecological, social, economic, and management linkages for a high-priority fishery. Third, quantitative modeling addressing Council-specified questions and based on interactions identified in the conceptual model is applied to evaluate alternative management strategies that best balance management objectives. As strategies are implemented, outcomes are monitored and the process is adjusted, and/or another priority identified in risk assessment can be addressed. --- ## Mid-Atlantic Council risk assessment framework Clarify exactly what we are assessing and why * *What are we measuring?* → **Risk Element** * *Why are we measuring it?* → **Risk Definition** * *How are we measuring it?* → **Indicator** * *What is the risk?* → **Risk Ranking Criteria** Iterative process starting with the Council workshops * Council staff and scientists create examples based on Council input ↑ ↓ ↑ ↓ ↑ ↓ ↑ ↓ ↑ ↓ ↑ ↓ ... * Council discusses, clarifies, revises with public input Risk assessment paper<sup>1</sup>: https://www.frontiersin.org/articles/10.3389/fmars.2018.00442/full .footnote[ [1] Gaichas, S. K., DePiper, G. S., Seagraves, R. J., Muffley, B. W., Sabo, M., Colburn, L. L., and Loftus, A. L. 2018. Implementing Ecosystem Approaches to Fishery Management: Risk Assessment in the US Mid-Atlantic. Frontiers in Marine Science, 5. ] --- ## Council-defined risk elements: Ecological <table class="table table-striped table-condensed" style="font-size: 12px; margin-left: auto; margin-right: auto;"> <thead> <tr> <th style="text-align:left;"> Element </th> <th style="text-align:left;"> Definition </th> <th style="text-align:left;"> Indicators </th> </tr> </thead> <tbody> <tr grouplength="11"><td colspan="3" style="border-bottom: 1px solid;"><strong>Ecological</strong></td></tr> <tr> <td style="text-align:left; padding-left: 2em;" indentlevel="1"> Assessment performance </td> <td style="text-align:left;"> Risk of not achieving OY due to analytical limitations </td> <td style="text-align:left;"> Current assessment method/data quality </td> </tr> <tr> <td style="text-align:left; padding-left: 2em;" indentlevel="1"> F status </td> <td style="text-align:left;"> Risk of not achieving OY due to overfishing </td> <td style="text-align:left;"> Current F relative to reference F from assessment </td> </tr> <tr> <td style="text-align:left; padding-left: 2em;" indentlevel="1"> B status </td> <td style="text-align:left;"> Risk of not achieving OY due to depleted stock </td> <td style="text-align:left;"> Current B relative to reference B from assessment </td> </tr> <tr> <td style="text-align:left; padding-left: 2em;" indentlevel="1"> Food web (MAFMC Predator) </td> <td style="text-align:left;"> Risk of not achieving OY due to MAFMC managed species interactions </td> <td style="text-align:left;"> Diet composition, management measures </td> </tr> <tr> <td style="text-align:left; padding-left: 2em;" indentlevel="1"> Food web (MAFMC Prey) </td> <td style="text-align:left;"> Risk of not achieving OY due to MAFMC managed species interactions </td> <td style="text-align:left;"> Diet composition, management measures </td> </tr> <tr> <td style="text-align:left; padding-left: 2em;" indentlevel="1"> Food web (Protected Species Prey) </td> <td style="text-align:left;"> Risk of not achieving protected species objectives due to species interactions </td> <td style="text-align:left;"> Diet composition, management measures </td> </tr> <tr> <td style="text-align:left; padding-left: 2em;" indentlevel="1"> Ecosystem productivity </td> <td style="text-align:left;"> Risk of not achieving OY due to changing system productivity </td> <td style="text-align:left;"> Four indicators, see text </td> </tr> <tr> <td style="text-align:left; padding-left: 2em;" indentlevel="1"> Climate </td> <td style="text-align:left;"> Risk of not achieving OY due to climate vulnerability </td> <td style="text-align:left;"> Northeast Climate Vulnerability Assessment </td> </tr> <tr> <td style="text-align:left; padding-left: 2em;" indentlevel="1"> Distribution shifts </td> <td style="text-align:left;"> Risk of not achieving OY due to climate-driven distribution shifts </td> <td style="text-align:left;"> Northeast Climate Vulnerability Assessment + 2 indicators </td> </tr> <tr> <td style="text-align:left; padding-left: 2em;" indentlevel="1"> Estuarine habitat </td> <td style="text-align:left;"> Risk of not achieving OY due to threats to estuarine/nursery habitat </td> <td style="text-align:left;"> Enumerated threats + estuarine dependence </td> </tr> <tr> <td style="text-align:left; padding-left: 2em;" indentlevel="1"> Offshore habitat </td> <td style="text-align:left;"> Risk of not achieving OY due to changing offshore habitat </td> <td style="text-align:left;"> Integrated habitat model index </td> </tr> </tbody> </table> --- ## Risk elements: Economic, Social, and Food Production <table class="table table-striped table-condensed" style="font-size: 14px; margin-left: auto; margin-right: auto;"> <thead> <tr> <th style="text-align:left;"> Element </th> <th style="text-align:left;"> Definition </th> <th style="text-align:left;"> Indicators </th> </tr> </thead> <tbody> <tr grouplength="4"><td colspan="3" style="border-bottom: 1px solid;"><strong>Economic</strong></td></tr> <tr> <td style="text-align:left; padding-left: 2em;" indentlevel="1"> Commercial Revenue </td> <td style="text-align:left;"> Risk of not maximizing fishery value </td> <td style="text-align:left;"> Revenue in aggregate </td> </tr> <tr> <td style="text-align:left; padding-left: 2em;" indentlevel="1"> Recreational Angler Days/Trips </td> <td style="text-align:left;"> Risk of not maximizing fishery value </td> <td style="text-align:left;"> Numbers of anglers and trips in aggregate </td> </tr> <tr> <td style="text-align:left; padding-left: 2em;" indentlevel="1"> Commercial Fishery Resilience (Revenue Diversity) </td> <td style="text-align:left;"> Risk of reduced fishery business resilience </td> <td style="text-align:left;"> Species diversity of revenue </td> </tr> <tr> <td style="text-align:left; padding-left: 2em;" indentlevel="1"> Commercial Fishery Resilience (Shoreside Support) </td> <td style="text-align:left;"> Risk of reduced fishery business resilience due to shoreside support infrastructure </td> <td style="text-align:left;"> Number of shoreside support businesses </td> </tr> <tr grouplength="2"><td colspan="3" style="border-bottom: 1px solid;"><strong>Social</strong></td></tr> <tr> <td style="text-align:left; padding-left: 2em;" indentlevel="1"> Fleet Resilience </td> <td style="text-align:left;"> Risk of reduced fishery resilience </td> <td style="text-align:left;"> Number of fleets, fleet diversity </td> </tr> <tr> <td style="text-align:left; padding-left: 2em;" indentlevel="1"> Social-Cultural </td> <td style="text-align:left;"> Risk of reduced community resilience </td> <td style="text-align:left;"> Community vulnerability, fishery engagement and reliance </td> </tr> <tr grouplength="2"><td colspan="3" style="border-bottom: 1px solid;"><strong>Food Production</strong></td></tr> <tr> <td style="text-align:left; padding-left: 2em;" indentlevel="1"> Commercial </td> <td style="text-align:left;"> Risk of not optimizing seafood production </td> <td style="text-align:left;"> Seafood landings in aggregate </td> </tr> <tr> <td style="text-align:left; padding-left: 2em;" indentlevel="1"> Recreational </td> <td style="text-align:left;"> Risk of not maintaining personal food production </td> <td style="text-align:left;"> Recreational landings in aggregate </td> </tr> </tbody> </table> --- ## Risk elements: Management <table class="table table-striped table-condensed" style="font-size: 14px; margin-left: auto; margin-right: auto;"> <thead> <tr> <th style="text-align:left;"> Element </th> <th style="text-align:left;"> Definition </th> <th style="text-align:left;"> Indicators </th> </tr> </thead> <tbody> <tr grouplength="6"><td colspan="3" style="border-bottom: 1px solid;"><strong>Management</strong></td></tr> <tr> <td style="text-align:left; padding-left: 2em;" indentlevel="1"> Control </td> <td style="text-align:left;"> Risk of not achieving OY due to inadequate control </td> <td style="text-align:left;"> Catch compared to allocation </td> </tr> <tr> <td style="text-align:left; padding-left: 2em;" indentlevel="1"> Interactions </td> <td style="text-align:left;"> Risk of not achieving OY due to interactions with species managed by other entities </td> <td style="text-align:left;"> Number and type of interactions with protected or non-MAFMC managed species, co-management </td> </tr> <tr> <td style="text-align:left; padding-left: 2em;" indentlevel="1"> Other ocean uses </td> <td style="text-align:left;"> Risk of not achieving OY due to other human uses </td> <td style="text-align:left;"> Fishery overlap with energy/mining areas </td> </tr> <tr> <td style="text-align:left; padding-left: 2em;" indentlevel="1"> Regulatory complexity </td> <td style="text-align:left;"> Risk of not achieving compliance due to complexity </td> <td style="text-align:left;"> Number of regulations by species </td> </tr> <tr> <td style="text-align:left; padding-left: 2em;" indentlevel="1"> Discards </td> <td style="text-align:left;"> Risk of not minimizing bycatch to extent practicable </td> <td style="text-align:left;"> Standardized Bycatch Reporting </td> </tr> <tr> <td style="text-align:left; padding-left: 2em;" indentlevel="1"> Allocation </td> <td style="text-align:left;"> Risk of not achieving OY due to spatial mismatch of stocks and management </td> <td style="text-align:left;"> Distribution shifts + number of interests </td> </tr> </tbody> </table> --- background-image: url("EDAB_images/IMG_2246.jpg") background-size: cover ## <center>But where will the risk assessment indicators come from?</center> --- ## State of the Ecosystem Reports! See the [SOE update presentation](https://noaa-edab.github.io/presentations/20200508_US_SOEUpdate_Gaichas.html) * Originally based on the 2017 SOE, the risk assessment was updated and published in 2018<sup>1</sup>. * The Council received updates in 2019 and 2020. .center[  ] .footnote[ [1] Gaichas, S. K., DePiper, G. S., Seagraves, R. J., Muffley, B. W., Sabo, M., Colburn, L. L., and Loftus, A. L. 2018. Implementing Ecosystem Approaches to Fishery Management: Risk Assessment in the US Mid-Atlantic. Frontiers in Marine Science, 5. ] ??? State of the ecosystem reports were revised to emphasize linkages between management objectives, local social systems, human activities, marine habitat, the environment, and the marine ecological community. --- ## Risk assessent indicators and ranking criteria: Commercial revenue This element is applied at the ecosystem level. Revenue serves as a proxy for commercial profits. .table[ .pull-left[ | Risk Level | Definition | |:-------------------|:--------------------------------------------------------------------| | Low | No trend and low variability in revenue | | Low-Moderate | Increasing or high variability in revenue | | Moderate-High | Significant long term revenue decrease | | High | Significant recent decrease in revenue | ] ] .pull-right[   ] Ranked moderate-high risk due to the significant long term revenue decrease for Mid-Atlantic managed species (red points in top plot) --- ## Risk assessent indicators and ranking criteria: System productivity This element is applied at the ecosystem level, and ranks the risk of not achieving optimum yield due to changes in ecosystem productivity at the base of the food web. Four indicators are used together to assess risk of changing ecosystem productivity: primary production, zooplankton abundance, fish condition and fish recruitment. .table[ | Risk Level | Definition | |:-------------------|:--------------------------------------------------------------------| | Low | No trends in ecosystem productivity | | Low-Moderate | Trend in ecosystem productivity (1-2 measures, increase or decrease) | | Moderate-High | Trend in ecosystem productivity (3+ measures, increase or decrease) | | High | Decreasing trend in ecosystem productivity, all measures | ] ??? We examine trends in total primary production, zooplankton abundance for a key Mid-Atlantic species, and two aggregate fish productivity measures: condition factor (weight divided by length of individual fish) and a survey based "recruitment" (small fish to large fish) index. --- ## Risk assessent indicators and ranking criteria: System productivity .pull-left[ <!-- --> .center[  ] ] .pull-right[ <!-- --> <!-- --> ] Ranked low-moderate risk due to the significant long term trends in zooplankton abundance for major species (top right plot) --- ## Risk assessent indicators and ranking criteria: Climate This element is applied at the species level. Risks to species productivity (and therefore to achieving optimum yield) due to projected climate change in the Northeast US were evaluated in a comprehensive assessment<sup>1</sup>. .table[ .pull-left[ | Risk Level | Definition | |:-------------------|:--------------------------------------------------------------------| | Low | Low climate vulnerability ranking | | Low-Moderate | Moderate climate vulnerability ranking | | Moderate-High | High climate vulnerability ranking | | High | Very high climate vulnerability ranking | ] ] .pull-right[  ] .footnote[ [1] Hare, J. A., Morrison, W. E., Nelson, M. W., Stachura, M. M., Teeters, E. J., Griffis, R. B., Alexander, M. A., et al. 2016. A Vulnerability Assessment of Fish and Invertebrates to Climate Change on the Northeast U.S. Continental Shelf. PLOS ONE, 11: e0146756. https://journals.plos.org/plosone/article?id=10.1371/journal.pone.0146756. ] Each species ranked according to position/color in the plot on the right --- ## EAFM Risk Assessment: 2020 update Management elements updated from original 2017 risk assessment; added risk rankings for chub mackerel and unmanaged forage fish. ### Decreased Risk (5) * Regulatory complexity risk for summer flounder decreased from high to med-high due to increased consistency in recent years * Technical interaction risk for commercial scup decreased from med-high to low-med because no accountability measures have been triggered * Allocation risks for recreational Atlantic mackerel, commercial longfin squid, and commercial spiny dogfish dropped from high to low due to changes in management approaches ### Increased Risk (15) * Bluefish status went from not overfished to overfished * Increased discards (5), reduced management control (4), allocation (3), other ocean uses (1), regulatory complexity (1) --- ## EAFM Risk Assessment: 2020 update *Species level risk elements* <table class="risktable table" style="font-size: 14px; margin-left: auto; margin-right: auto;"> <thead> <tr> <th style="text-align:left;"> Species </th> <th style="text-align:left;"> Assess </th> <th style="text-align:left;"> Fstatus </th> <th style="text-align:left;"> Bstatus </th> <th style="text-align:left;"> FW1Pred </th> <th style="text-align:left;"> FW1Prey </th> <th style="text-align:left;"> FW2Prey </th> <th style="text-align:left;"> Climate </th> <th style="text-align:left;"> DistShift </th> <th style="text-align:left;"> EstHabitat </th> </tr> </thead> <tbody> <tr> <td style="text-align:left;"> Ocean Quahog </td> <td style="text-align:left;"> <span style=" color: black !important;padding-right: 4px; padding-left: 4px; background-color: lightgreen !important;text-align: c;">lowest</span> </td> <td style="text-align:left;"> <span style=" color: black !important;padding-right: 4px; padding-left: 4px; background-color: lightgreen !important;text-align: c;">lowest</span> </td> <td style="text-align:left;"> <span style=" color: black !important;padding-right: 4px; padding-left: 4px; background-color: lightgreen !important;text-align: c;">lowest</span> </td> <td style="text-align:left;"> <span style=" color: black !important;padding-right: 4px; padding-left: 4px; background-color: lightgreen !important;text-align: c;">lowest</span> </td> <td style="text-align:left;"> <span style=" color: black !important;padding-right: 4px; padding-left: 4px; background-color: lightgreen !important;text-align: c;">lowest</span> </td> <td style="text-align:left;"> <span style=" color: black !important;padding-right: 4px; padding-left: 4px; background-color: lightgreen !important;text-align: c;">lowest</span> </td> <td style="text-align:left;"> <span style=" color: white !important;padding-right: 4px; padding-left: 4px; background-color: red !important;text-align: c;">highest</span> </td> <td style="text-align:left;"> <span style=" color: black !important;padding-right: 4px; padding-left: 4px; background-color: orange !important;text-align: c;">modhigh</span> </td> <td style="text-align:left;"> <span style=" color: black !important;padding-right: 4px; padding-left: 4px; background-color: lightgreen !important;text-align: c;">lowest</span> </td> </tr> <tr> <td style="text-align:left;"> Surfclam </td> <td style="text-align:left;"> <span style=" color: black !important;padding-right: 4px; padding-left: 4px; background-color: lightgreen !important;text-align: c;">lowest</span> </td> <td style="text-align:left;"> <span style=" color: black !important;padding-right: 4px; padding-left: 4px; background-color: lightgreen !important;text-align: c;">lowest</span> </td> <td style="text-align:left;"> <span style=" color: black !important;padding-right: 4px; padding-left: 4px; background-color: lightgreen !important;text-align: c;">lowest</span> </td> <td style="text-align:left;"> <span style=" color: black !important;padding-right: 4px; padding-left: 4px; background-color: lightgreen !important;text-align: c;">lowest</span> </td> <td style="text-align:left;"> <span style=" color: black !important;padding-right: 4px; padding-left: 4px; background-color: lightgreen !important;text-align: c;">lowest</span> </td> <td style="text-align:left;"> <span style=" color: black !important;padding-right: 4px; padding-left: 4px; background-color: lightgreen !important;text-align: c;">lowest</span> </td> <td style="text-align:left;"> <span style=" color: black !important;padding-right: 4px; padding-left: 4px; background-color: orange !important;text-align: c;">modhigh</span> </td> <td style="text-align:left;"> <span style=" color: black !important;padding-right: 4px; padding-left: 4px; background-color: orange !important;text-align: c;">modhigh</span> </td> <td style="text-align:left;"> <span style=" color: black !important;padding-right: 4px; padding-left: 4px; background-color: lightgreen !important;text-align: c;">lowest</span> </td> </tr> <tr> <td style="text-align:left;"> Summer flounder </td> <td style="text-align:left;"> <span style=" color: black !important;padding-right: 4px; padding-left: 4px; background-color: lightgreen !important;text-align: c;">lowest</span> </td> <td style="text-align:left;"> <span style=" color: black !important;padding-right: 4px; padding-left: 4px; background-color: lightgreen !important;text-align: c;">lowest</span> </td> <td style="text-align:left;"> <span style=" color: black !important;padding-right: 4px; padding-left: 4px; background-color: yellow !important;text-align: c;">lowmod</span> </td> <td style="text-align:left;"> <span style=" color: black !important;padding-right: 4px; padding-left: 4px; background-color: lightgreen !important;text-align: c;">lowest</span> </td> <td style="text-align:left;"> <span style=" color: black !important;padding-right: 4px; padding-left: 4px; background-color: lightgreen !important;text-align: c;">lowest</span> </td> <td style="text-align:left;"> <span style=" color: black !important;padding-right: 4px; padding-left: 4px; background-color: lightgreen !important;text-align: c;">lowest</span> </td> <td style="text-align:left;"> <span style=" color: black !important;padding-right: 4px; padding-left: 4px; background-color: yellow !important;text-align: c;">lowmod</span> </td> <td style="text-align:left;"> <span style=" color: black !important;padding-right: 4px; padding-left: 4px; background-color: orange !important;text-align: c;">modhigh</span> </td> <td style="text-align:left;"> <span style=" color: white !important;padding-right: 4px; padding-left: 4px; background-color: red !important;text-align: c;">highest</span> </td> </tr> <tr> <td style="text-align:left;"> Scup </td> <td style="text-align:left;"> <span style=" color: black !important;padding-right: 4px; padding-left: 4px; background-color: lightgreen !important;text-align: c;">lowest</span> </td> <td style="text-align:left;"> <span style=" color: black !important;padding-right: 4px; padding-left: 4px; background-color: lightgreen !important;text-align: c;">lowest</span> </td> <td style="text-align:left;"> <span style=" color: black !important;padding-right: 4px; padding-left: 4px; background-color: lightgreen !important;text-align: c;">lowest</span> </td> <td style="text-align:left;"> <span style=" color: black !important;padding-right: 4px; padding-left: 4px; background-color: lightgreen !important;text-align: c;">lowest</span> </td> <td style="text-align:left;"> <span style=" color: black !important;padding-right: 4px; padding-left: 4px; background-color: lightgreen !important;text-align: c;">lowest</span> </td> <td style="text-align:left;"> <span style=" color: black !important;padding-right: 4px; padding-left: 4px; background-color: lightgreen !important;text-align: c;">lowest</span> </td> <td style="text-align:left;"> <span style=" color: black !important;padding-right: 4px; padding-left: 4px; background-color: yellow !important;text-align: c;">lowmod</span> </td> <td style="text-align:left;"> <span style=" color: black !important;padding-right: 4px; padding-left: 4px; background-color: orange !important;text-align: c;">modhigh</span> </td> <td style="text-align:left;"> <span style=" color: white !important;padding-right: 4px; padding-left: 4px; background-color: red !important;text-align: c;">highest</span> </td> </tr> <tr> <td style="text-align:left;"> Black sea bass </td> <td style="text-align:left;"> <span style=" color: black !important;padding-right: 4px; padding-left: 4px; background-color: lightgreen !important;text-align: c;">lowest</span> </td> <td style="text-align:left;"> <span style=" color: black !important;padding-right: 4px; padding-left: 4px; background-color: lightgreen !important;text-align: c;">lowest</span> </td> <td style="text-align:left;"> <span style=" color: black !important;padding-right: 4px; padding-left: 4px; background-color: lightgreen !important;text-align: c;">lowest</span> </td> <td style="text-align:left;"> <span style=" color: black !important;padding-right: 4px; padding-left: 4px; background-color: lightgreen !important;text-align: c;">lowest</span> </td> <td style="text-align:left;"> <span style=" color: black !important;padding-right: 4px; padding-left: 4px; background-color: lightgreen !important;text-align: c;">lowest</span> </td> <td style="text-align:left;"> <span style=" color: black !important;padding-right: 4px; padding-left: 4px; background-color: lightgreen !important;text-align: c;">lowest</span> </td> <td style="text-align:left;"> <span style=" color: black !important;padding-right: 4px; padding-left: 4px; background-color: orange !important;text-align: c;">modhigh</span> </td> <td style="text-align:left;"> <span style=" color: black !important;padding-right: 4px; padding-left: 4px; background-color: orange !important;text-align: c;">modhigh</span> </td> <td style="text-align:left;"> <span style=" color: white !important;padding-right: 4px; padding-left: 4px; background-color: red !important;text-align: c;">highest</span> </td> </tr> <tr> <td style="text-align:left;"> Atl. mackerel </td> <td style="text-align:left;"> <span style=" color: black !important;padding-right: 4px; padding-left: 4px; background-color: lightgreen !important;text-align: c;">lowest</span> </td> <td style="text-align:left;"> <span style=" color: white !important;padding-right: 4px; padding-left: 4px; background-color: red !important;text-align: c;">highest</span> </td> <td style="text-align:left;"> <span style=" color: white !important;padding-right: 4px; padding-left: 4px; background-color: red !important;text-align: c;">highest</span> </td> <td style="text-align:left;"> <span style=" color: black !important;padding-right: 4px; padding-left: 4px; background-color: lightgreen !important;text-align: c;">lowest</span> </td> <td style="text-align:left;"> <span style=" color: black !important;padding-right: 4px; padding-left: 4px; background-color: lightgreen !important;text-align: c;">lowest</span> </td> <td style="text-align:left;"> <span style=" color: black !important;padding-right: 4px; padding-left: 4px; background-color: lightgreen !important;text-align: c;">lowest</span> </td> <td style="text-align:left;"> <span style=" color: black !important;padding-right: 4px; padding-left: 4px; background-color: yellow !important;text-align: c;">lowmod</span> </td> <td style="text-align:left;"> <span style=" color: black !important;padding-right: 4px; padding-left: 4px; background-color: orange !important;text-align: c;">modhigh</span> </td> <td style="text-align:left;"> <span style=" color: black !important;padding-right: 4px; padding-left: 4px; background-color: lightgreen !important;text-align: c;">lowest</span> </td> </tr> <tr> <td style="text-align:left;"> Butterfish </td> <td style="text-align:left;"> <span style=" color: black !important;padding-right: 4px; padding-left: 4px; background-color: lightgreen !important;text-align: c;">lowest</span> </td> <td style="text-align:left;"> <span style=" color: black !important;padding-right: 4px; padding-left: 4px; background-color: lightgreen !important;text-align: c;">lowest</span> </td> <td style="text-align:left;"> <span style=" color: black !important;padding-right: 4px; padding-left: 4px; background-color: lightgreen !important;text-align: c;">lowest</span> </td> <td style="text-align:left;"> <span style=" color: black !important;padding-right: 4px; padding-left: 4px; background-color: lightgreen !important;text-align: c;">lowest</span> </td> <td style="text-align:left;"> <span style=" color: black !important;padding-right: 4px; padding-left: 4px; background-color: lightgreen !important;text-align: c;">lowest</span> </td> <td style="text-align:left;"> <span style=" color: black !important;padding-right: 4px; padding-left: 4px; background-color: lightgreen !important;text-align: c;">lowest</span> </td> <td style="text-align:left;"> <span style=" color: black !important;padding-right: 4px; padding-left: 4px; background-color: lightgreen !important;text-align: c;">lowest</span> </td> <td style="text-align:left;"> <span style=" color: white !important;padding-right: 4px; padding-left: 4px; background-color: red !important;text-align: c;">highest</span> </td> <td style="text-align:left;"> <span style=" color: black !important;padding-right: 4px; padding-left: 4px; background-color: lightgreen !important;text-align: c;">lowest</span> </td> </tr> <tr> <td style="text-align:left;"> Longfin squid </td> <td style="text-align:left;"> <span style=" color: black !important;padding-right: 4px; padding-left: 4px; background-color: yellow !important;text-align: c;">lowmod</span> </td> <td style="text-align:left;"> <span style=" color: black !important;padding-right: 4px; padding-left: 4px; background-color: yellow !important;text-align: c;">lowmod</span> </td> <td style="text-align:left;"> <span style=" color: black !important;padding-right: 4px; padding-left: 4px; background-color: yellow !important;text-align: c;">lowmod</span> </td> <td style="text-align:left;"> <span style=" color: black !important;padding-right: 4px; padding-left: 4px; background-color: lightgreen !important;text-align: c;">lowest</span> </td> <td style="text-align:left;"> <span style=" color: black !important;padding-right: 4px; padding-left: 4px; background-color: lightgreen !important;text-align: c;">lowest</span> </td> <td style="text-align:left;"> <span style=" color: black !important;padding-right: 4px; padding-left: 4px; background-color: yellow !important;text-align: c;">lowmod</span> </td> <td style="text-align:left;"> <span style=" color: black !important;padding-right: 4px; padding-left: 4px; background-color: lightgreen !important;text-align: c;">lowest</span> </td> <td style="text-align:left;"> <span style=" color: black !important;padding-right: 4px; padding-left: 4px; background-color: orange !important;text-align: c;">modhigh</span> </td> <td style="text-align:left;"> <span style=" color: black !important;padding-right: 4px; padding-left: 4px; background-color: lightgreen !important;text-align: c;">lowest</span> </td> </tr> <tr> <td style="text-align:left;"> Shortfin squid </td> <td style="text-align:left;"> <span style=" color: black !important;padding-right: 4px; padding-left: 4px; background-color: yellow !important;text-align: c;">lowmod</span> </td> <td style="text-align:left;"> <span style=" color: black !important;padding-right: 4px; padding-left: 4px; background-color: yellow !important;text-align: c;">lowmod</span> </td> <td style="text-align:left;"> <span style=" color: black !important;padding-right: 4px; padding-left: 4px; background-color: yellow !important;text-align: c;">lowmod</span> </td> <td style="text-align:left;"> <span style=" color: black !important;padding-right: 4px; padding-left: 4px; background-color: lightgreen !important;text-align: c;">lowest</span> </td> <td style="text-align:left;"> <span style=" color: black !important;padding-right: 4px; padding-left: 4px; background-color: lightgreen !important;text-align: c;">lowest</span> </td> <td style="text-align:left;"> <span style=" color: black !important;padding-right: 4px; padding-left: 4px; background-color: yellow !important;text-align: c;">lowmod</span> </td> <td style="text-align:left;"> <span style=" color: black !important;padding-right: 4px; padding-left: 4px; background-color: lightgreen !important;text-align: c;">lowest</span> </td> <td style="text-align:left;"> <span style=" color: white !important;padding-right: 4px; padding-left: 4px; background-color: red !important;text-align: c;">highest</span> </td> <td style="text-align:left;"> <span style=" color: black !important;padding-right: 4px; padding-left: 4px; background-color: lightgreen !important;text-align: c;">lowest</span> </td> </tr> <tr> <td style="text-align:left;"> Golden tilefish </td> <td style="text-align:left;"> <span style=" color: black !important;padding-right: 4px; padding-left: 4px; background-color: lightgreen !important;text-align: c;">lowest</span> </td> <td style="text-align:left;"> <span style=" color: black !important;padding-right: 4px; padding-left: 4px; background-color: lightgreen !important;text-align: c;">lowest</span> </td> <td style="text-align:left;"> <span style=" color: black !important;padding-right: 4px; padding-left: 4px; background-color: yellow !important;text-align: c;">lowmod</span> </td> <td style="text-align:left;"> <span style=" color: black !important;padding-right: 4px; padding-left: 4px; background-color: lightgreen !important;text-align: c;">lowest</span> </td> <td style="text-align:left;"> <span style=" color: black !important;padding-right: 4px; padding-left: 4px; background-color: lightgreen !important;text-align: c;">lowest</span> </td> <td style="text-align:left;"> <span style=" color: black !important;padding-right: 4px; padding-left: 4px; background-color: lightgreen !important;text-align: c;">lowest</span> </td> <td style="text-align:left;"> <span style=" color: black !important;padding-right: 4px; padding-left: 4px; background-color: orange !important;text-align: c;">modhigh</span> </td> <td style="text-align:left;"> <span style=" color: black !important;padding-right: 4px; padding-left: 4px; background-color: lightgreen !important;text-align: c;">lowest</span> </td> <td style="text-align:left;"> <span style=" color: black !important;padding-right: 4px; padding-left: 4px; background-color: lightgreen !important;text-align: c;">lowest</span> </td> </tr> <tr> <td style="text-align:left;"> Blueline tilefish </td> <td style="text-align:left;"> <span style=" color: white !important;padding-right: 4px; padding-left: 4px; background-color: red !important;text-align: c;">highest</span> </td> <td style="text-align:left;"> <span style=" color: white !important;padding-right: 4px; padding-left: 4px; background-color: red !important;text-align: c;">highest</span> </td> <td style="text-align:left;"> <span style=" color: black !important;padding-right: 4px; padding-left: 4px; background-color: orange !important;text-align: c;">modhigh</span> </td> <td style="text-align:left;"> <span style=" color: black !important;padding-right: 4px; padding-left: 4px; background-color: lightgreen !important;text-align: c;">lowest</span> </td> <td style="text-align:left;"> <span style=" color: black !important;padding-right: 4px; padding-left: 4px; background-color: lightgreen !important;text-align: c;">lowest</span> </td> <td style="text-align:left;"> <span style=" color: black !important;padding-right: 4px; padding-left: 4px; background-color: lightgreen !important;text-align: c;">lowest</span> </td> <td style="text-align:left;"> <span style=" color: black !important;padding-right: 4px; padding-left: 4px; background-color: orange !important;text-align: c;">modhigh</span> </td> <td style="text-align:left;"> <span style=" color: black !important;padding-right: 4px; padding-left: 4px; background-color: lightgreen !important;text-align: c;">lowest</span> </td> <td style="text-align:left;"> <span style=" color: black !important;padding-right: 4px; padding-left: 4px; background-color: lightgreen !important;text-align: c;">lowest</span> </td> </tr> <tr> <td style="text-align:left;"> Bluefish </td> <td style="text-align:left;"> <span style=" color: black !important;padding-right: 4px; padding-left: 4px; background-color: lightgreen !important;text-align: c;">lowest</span> </td> <td style="text-align:left;"> <span style=" color: black !important;padding-right: 4px; padding-left: 4px; background-color: lightgreen !important;text-align: c;">lowest</span> </td> <td style="text-align:left;"> <span style=" color: white !important;padding-right: 4px; padding-left: 4px; background-color: red !important;text-align: c;">highest</span> </td> <td style="text-align:left;"> <span style=" color: black !important;padding-right: 4px; padding-left: 4px; background-color: lightgreen !important;text-align: c;">lowest</span> </td> <td style="text-align:left;"> <span style=" color: black !important;padding-right: 4px; padding-left: 4px; background-color: lightgreen !important;text-align: c;">lowest</span> </td> <td style="text-align:left;"> <span style=" color: black !important;padding-right: 4px; padding-left: 4px; background-color: lightgreen !important;text-align: c;">lowest</span> </td> <td style="text-align:left;"> <span style=" color: black !important;padding-right: 4px; padding-left: 4px; background-color: lightgreen !important;text-align: c;">lowest</span> </td> <td style="text-align:left;"> <span style=" color: black !important;padding-right: 4px; padding-left: 4px; background-color: orange !important;text-align: c;">modhigh</span> </td> <td style="text-align:left;"> <span style=" color: white !important;padding-right: 4px; padding-left: 4px; background-color: red !important;text-align: c;">highest</span> </td> </tr> <tr> <td style="text-align:left;"> Spiny dogfish </td> <td style="text-align:left;"> <span style=" color: black !important;padding-right: 4px; padding-left: 4px; background-color: yellow !important;text-align: c;">lowmod</span> </td> <td style="text-align:left;"> <span style=" color: black !important;padding-right: 4px; padding-left: 4px; background-color: lightgreen !important;text-align: c;">lowest</span> </td> <td style="text-align:left;"> <span style=" color: black !important;padding-right: 4px; padding-left: 4px; background-color: yellow !important;text-align: c;">lowmod</span> </td> <td style="text-align:left;"> <span style=" color: black !important;padding-right: 4px; padding-left: 4px; background-color: lightgreen !important;text-align: c;">lowest</span> </td> <td style="text-align:left;"> <span style=" color: black !important;padding-right: 4px; padding-left: 4px; background-color: lightgreen !important;text-align: c;">lowest</span> </td> <td style="text-align:left;"> <span style=" color: black !important;padding-right: 4px; padding-left: 4px; background-color: lightgreen !important;text-align: c;">lowest</span> </td> <td style="text-align:left;"> <span style=" color: black !important;padding-right: 4px; padding-left: 4px; background-color: lightgreen !important;text-align: c;">lowest</span> </td> <td style="text-align:left;"> <span style=" color: white !important;padding-right: 4px; padding-left: 4px; background-color: red !important;text-align: c;">highest</span> </td> <td style="text-align:left;"> <span style=" color: black !important;padding-right: 4px; padding-left: 4px; background-color: lightgreen !important;text-align: c;">lowest</span> </td> </tr> <tr> <td style="text-align:left;"> Monkfish </td> <td style="text-align:left;"> <span style=" color: white !important;padding-right: 4px; padding-left: 4px; background-color: red !important;text-align: c;">highest</span> </td> <td style="text-align:left;"> <span style=" color: black !important;padding-right: 4px; padding-left: 4px; background-color: yellow !important;text-align: c;">lowmod</span> </td> <td style="text-align:left;"> <span style=" color: black !important;padding-right: 4px; padding-left: 4px; background-color: yellow !important;text-align: c;">lowmod</span> </td> <td style="text-align:left;"> <span style=" color: black !important;padding-right: 4px; padding-left: 4px; background-color: lightgreen !important;text-align: c;">lowest</span> </td> <td style="text-align:left;"> <span style=" color: black !important;padding-right: 4px; padding-left: 4px; background-color: lightgreen !important;text-align: c;">lowest</span> </td> <td style="text-align:left;"> <span style=" color: black !important;padding-right: 4px; padding-left: 4px; background-color: lightgreen !important;text-align: c;">lowest</span> </td> <td style="text-align:left;"> <span style=" color: black !important;padding-right: 4px; padding-left: 4px; background-color: lightgreen !important;text-align: c;">lowest</span> </td> <td style="text-align:left;"> <span style=" color: black !important;padding-right: 4px; padding-left: 4px; background-color: orange !important;text-align: c;">modhigh</span> </td> <td style="text-align:left;"> <span style=" color: black !important;padding-right: 4px; padding-left: 4px; background-color: lightgreen !important;text-align: c;">lowest</span> </td> </tr> <tr> <td style="text-align:left;"> Unmanaged forage </td> <td style="text-align:left;"> <span style=" color: black !important;padding-right: 4px; padding-left: 4px; background-color: white !important;text-align: c;">na</span> </td> <td style="text-align:left;"> <span style=" color: black !important;padding-right: 4px; padding-left: 4px; background-color: white !important;text-align: c;">na</span> </td> <td style="text-align:left;"> <span style=" color: black !important;padding-right: 4px; padding-left: 4px; background-color: white !important;text-align: c;">na</span> </td> <td style="text-align:left;"> <span style=" color: black !important;padding-right: 4px; padding-left: 4px; background-color: lightgreen !important;text-align: c;">lowest</span> </td> <td style="text-align:left;"> <span style=" color: black !important;padding-right: 4px; padding-left: 4px; background-color: yellow !important;text-align: c;">lowmod</span> </td> <td style="text-align:left;"> <span style=" color: black !important;padding-right: 4px; padding-left: 4px; background-color: yellow !important;text-align: c;">lowmod</span> </td> <td style="text-align:left;"> <span style=" color: black !important;padding-right: 4px; padding-left: 4px; background-color: white !important;text-align: c;">na</span> </td> <td style="text-align:left;"> <span style=" color: black !important;padding-right: 4px; padding-left: 4px; background-color: white !important;text-align: c;">na</span> </td> <td style="text-align:left;"> <span style=" color: black !important;padding-right: 4px; padding-left: 4px; background-color: white !important;text-align: c;">na</span> </td> </tr> <tr> <td style="text-align:left;"> Deepsea corals </td> <td style="text-align:left;"> <span style=" color: black !important;padding-right: 4px; padding-left: 4px; background-color: white !important;text-align: c;">na</span> </td> <td style="text-align:left;"> <span style=" color: black !important;padding-right: 4px; padding-left: 4px; background-color: white !important;text-align: c;">na</span> </td> <td style="text-align:left;"> <span style=" color: black !important;padding-right: 4px; padding-left: 4px; background-color: white !important;text-align: c;">na</span> </td> <td style="text-align:left;"> <span style=" color: black !important;padding-right: 4px; padding-left: 4px; background-color: lightgreen !important;text-align: c;">lowest</span> </td> <td style="text-align:left;"> <span style=" color: black !important;padding-right: 4px; padding-left: 4px; background-color: lightgreen !important;text-align: c;">lowest</span> </td> <td style="text-align:left;"> <span style=" color: black !important;padding-right: 4px; padding-left: 4px; background-color: lightgreen !important;text-align: c;">lowest</span> </td> <td style="text-align:left;"> <span style=" color: black !important;padding-right: 4px; padding-left: 4px; background-color: white !important;text-align: c;">na</span> </td> <td style="text-align:left;"> <span style=" color: black !important;padding-right: 4px; padding-left: 4px; background-color: white !important;text-align: c;">na</span> </td> <td style="text-align:left;"> <span style=" color: black !important;padding-right: 4px; padding-left: 4px; background-color: white !important;text-align: c;">na</span> </td> </tr> </tbody> </table> *Ecosystem level risk elements* <table class="risktable table" style="font-size: 14px; margin-left: auto; margin-right: auto;"> <thead> <tr> <th style="text-align:left;"> System </th> <th style="text-align:left;"> EcoProd </th> <th style="text-align:left;"> CommRev </th> <th style="text-align:left;"> RecVal </th> <th style="text-align:left;"> FishRes1 </th> <th style="text-align:left;"> FishRes4 </th> <th style="text-align:left;"> FleetDiv </th> <th style="text-align:left;"> Social </th> <th style="text-align:left;"> ComFood </th> <th style="text-align:left;"> RecFood </th> </tr> </thead> <tbody> <tr> <td style="text-align:left;"> Mid-Atlantic </td> <td style="text-align:left;"> <span style=" color: black !important;padding-right: 4px; padding-left: 4px; background-color: yellow !important;text-align: c;">lowmod</span> </td> <td style="text-align:left;"> <span style=" color: black !important;padding-right: 4px; padding-left: 4px; background-color: orange !important;text-align: c;">modhigh</span> </td> <td style="text-align:left;"> <span style=" color: white !important;padding-right: 4px; padding-left: 4px; background-color: red !important;text-align: c;">highest</span> </td> <td style="text-align:left;"> <span style=" color: black !important;padding-right: 4px; padding-left: 4px; background-color: lightgreen !important;text-align: c;">lowest</span> </td> <td style="text-align:left;"> <span style=" color: black !important;padding-right: 4px; padding-left: 4px; background-color: orange !important;text-align: c;">modhigh</span> </td> <td style="text-align:left;"> <span style=" color: black !important;padding-right: 4px; padding-left: 4px; background-color: lightgreen !important;text-align: c;">lowest</span> </td> <td style="text-align:left;"> <span style=" color: black !important;padding-right: 4px; padding-left: 4px; background-color: yellow !important;text-align: c;">lowmod</span> </td> <td style="text-align:left;"> <span style=" color: white !important;padding-right: 4px; padding-left: 4px; background-color: red !important;text-align: c;">highest</span> </td> <td style="text-align:left;"> <span style=" color: black !important;padding-right: 4px; padding-left: 4px; background-color: orange !important;text-align: c;">modhigh</span> </td> </tr> </tbody> </table> --- ## EAFM Risk Assessment: 2020 update *Species and Sector level risk elements* <table class="risktable table" style="font-size: 13px; margin-left: auto; margin-right: auto;"> <thead> <tr> <th style="text-align:left;"> Species </th> <th style="text-align:left;"> MgtControl </th> <th style="text-align:left;"> TecInteract </th> <th style="text-align:left;"> OceanUse </th> <th style="text-align:left;"> RegComplex </th> <th style="text-align:left;"> Discards </th> <th style="text-align:left;"> Allocation </th> </tr> </thead> <tbody> <tr> <td style="text-align:left;"> Ocean Quahog-C </td> <td style="text-align:left;"> <span style=" color: black !important;padding-right: 4px; padding-left: 4px; background-color: lightgreen !important;text-align: c;">lowest</span> </td> <td style="text-align:left;"> <span style=" color: black !important;padding-right: 4px; padding-left: 4px; background-color: lightgreen !important;text-align: c;">lowest</span> </td> <td style="text-align:left;"> <span style=" color: black !important;padding-right: 4px; padding-left: 4px; background-color: yellow !important;text-align: c;">lowmod</span> </td> <td style="text-align:left;"> <span style=" color: black !important;padding-right: 4px; padding-left: 4px; background-color: lightgreen !important;text-align: c;">lowest</span> </td> <td style="text-align:left;"> <span style=" color: black !important;padding-right: 4px; padding-left: 4px; background-color: orange !important;text-align: c;">modhigh</span> </td> <td style="text-align:left;"> <span style=" color: black !important;padding-right: 4px; padding-left: 4px; background-color: lightgreen !important;text-align: c;">lowest</span> </td> </tr> <tr> <td style="text-align:left;"> Surfclam-C </td> <td style="text-align:left;"> <span style=" color: black !important;padding-right: 4px; padding-left: 4px; background-color: lightgreen !important;text-align: c;">lowest</span> </td> <td style="text-align:left;"> <span style=" color: black !important;padding-right: 4px; padding-left: 4px; background-color: lightgreen !important;text-align: c;">lowest</span> </td> <td style="text-align:left;"> <span style=" color: black !important;padding-right: 4px; padding-left: 4px; background-color: yellow !important;text-align: c;">lowmod</span> </td> <td style="text-align:left;"> <span style=" color: black !important;padding-right: 4px; padding-left: 4px; background-color: lightgreen !important;text-align: c;">lowest</span> </td> <td style="text-align:left;"> <span style=" color: black !important;padding-right: 4px; padding-left: 4px; background-color: orange !important;text-align: c;">modhigh</span> </td> <td style="text-align:left;"> <span style=" color: black !important;padding-right: 4px; padding-left: 4px; background-color: lightgreen !important;text-align: c;">lowest</span> </td> </tr> <tr> <td style="text-align:left;"> Summer flounder-R </td> <td style="text-align:left;"> <span style=" color: black !important;padding-right: 4px; padding-left: 4px; background-color: orange !important;text-align: c;">modhigh</span> </td> <td style="text-align:left;"> <span style=" color: black !important;padding-right: 4px; padding-left: 4px; background-color: lightgreen !important;text-align: c;">lowest</span> </td> <td style="text-align:left;"> <span style=" color: black !important;padding-right: 4px; padding-left: 4px; background-color: yellow !important;text-align: c;">lowmod</span> </td> <td style="text-align:left;"> <span style=" color: black !important;padding-right: 4px; padding-left: 4px; background-color: orange !important;text-align: c;">modhigh</span> </td> <td style="text-align:left;"> <span style=" color: white !important;padding-right: 4px; padding-left: 4px; background-color: red !important;text-align: c;">highest</span> </td> <td style="text-align:left;"> <span style=" color: white !important;padding-right: 4px; padding-left: 4px; background-color: red !important;text-align: c;">highest</span> </td> </tr> <tr> <td style="text-align:left;"> Summer flounder-C </td> <td style="text-align:left;"> <span style=" color: black !important;padding-right: 4px; padding-left: 4px; background-color: yellow !important;text-align: c;">lowmod</span> </td> <td style="text-align:left;"> <span style=" color: black !important;padding-right: 4px; padding-left: 4px; background-color: orange !important;text-align: c;">modhigh</span> </td> <td style="text-align:left;"> <span style=" color: black !important;padding-right: 4px; padding-left: 4px; background-color: yellow !important;text-align: c;">lowmod</span> </td> <td style="text-align:left;"> <span style=" color: black !important;padding-right: 4px; padding-left: 4px; background-color: orange !important;text-align: c;">modhigh</span> </td> <td style="text-align:left;"> <span style=" color: black !important;padding-right: 4px; padding-left: 4px; background-color: orange !important;text-align: c;">modhigh</span> </td> <td style="text-align:left;"> <span style=" color: white !important;padding-right: 4px; padding-left: 4px; background-color: red !important;text-align: c;">highest</span> </td> </tr> <tr> <td style="text-align:left;"> Scup-R </td> <td style="text-align:left;"> <span style=" color: black !important;padding-right: 4px; padding-left: 4px; background-color: yellow !important;text-align: c;">lowmod</span> </td> <td style="text-align:left;"> <span style=" color: black !important;padding-right: 4px; padding-left: 4px; background-color: lightgreen !important;text-align: c;">lowest</span> </td> <td style="text-align:left;"> <span style=" color: black !important;padding-right: 4px; padding-left: 4px; background-color: yellow !important;text-align: c;">lowmod</span> </td> <td style="text-align:left;"> <span style=" color: black !important;padding-right: 4px; padding-left: 4px; background-color: orange !important;text-align: c;">modhigh</span> </td> <td style="text-align:left;"> <span style=" color: black !important;padding-right: 4px; padding-left: 4px; background-color: orange !important;text-align: c;">modhigh</span> </td> <td style="text-align:left;"> <span style=" color: white !important;padding-right: 4px; padding-left: 4px; background-color: red !important;text-align: c;">highest</span> </td> </tr> <tr> <td style="text-align:left;"> Scup-C </td> <td style="text-align:left;"> <span style=" color: black !important;padding-right: 4px; padding-left: 4px; background-color: lightgreen !important;text-align: c;">lowest</span> </td> <td style="text-align:left;"> <span style=" color: black !important;padding-right: 4px; padding-left: 4px; background-color: yellow !important;text-align: c;">lowmod</span> </td> <td style="text-align:left;"> <span style=" color: black !important;padding-right: 4px; padding-left: 4px; background-color: orange !important;text-align: c;">modhigh</span> </td> <td style="text-align:left;"> <span style=" color: black !important;padding-right: 4px; padding-left: 4px; background-color: orange !important;text-align: c;">modhigh</span> </td> <td style="text-align:left;"> <span style=" color: black !important;padding-right: 4px; padding-left: 4px; background-color: orange !important;text-align: c;">modhigh</span> </td> <td style="text-align:left;"> <span style=" color: white !important;padding-right: 4px; padding-left: 4px; background-color: red !important;text-align: c;">highest</span> </td> </tr> <tr> <td style="text-align:left;"> Black sea bass-R </td> <td style="text-align:left;"> <span style=" color: white !important;padding-right: 4px; padding-left: 4px; background-color: red !important;text-align: c;">highest</span> </td> <td style="text-align:left;"> <span style=" color: black !important;padding-right: 4px; padding-left: 4px; background-color: lightgreen !important;text-align: c;">lowest</span> </td> <td style="text-align:left;"> <span style=" color: black !important;padding-right: 4px; padding-left: 4px; background-color: orange !important;text-align: c;">modhigh</span> </td> <td style="text-align:left;"> <span style=" color: white !important;padding-right: 4px; padding-left: 4px; background-color: red !important;text-align: c;">highest</span> </td> <td style="text-align:left;"> <span style=" color: white !important;padding-right: 4px; padding-left: 4px; background-color: red !important;text-align: c;">highest</span> </td> <td style="text-align:left;"> <span style=" color: white !important;padding-right: 4px; padding-left: 4px; background-color: red !important;text-align: c;">highest</span> </td> </tr> <tr> <td style="text-align:left;"> Black sea bass-C </td> <td style="text-align:left;"> <span style=" color: white !important;padding-right: 4px; padding-left: 4px; background-color: red !important;text-align: c;">highest</span> </td> <td style="text-align:left;"> <span style=" color: black !important;padding-right: 4px; padding-left: 4px; background-color: yellow !important;text-align: c;">lowmod</span> </td> <td style="text-align:left;"> <span style=" color: white !important;padding-right: 4px; padding-left: 4px; background-color: red !important;text-align: c;">highest</span> </td> <td style="text-align:left;"> <span style=" color: black !important;padding-right: 4px; padding-left: 4px; background-color: orange !important;text-align: c;">modhigh</span> </td> <td style="text-align:left;"> <span style=" color: white !important;padding-right: 4px; padding-left: 4px; background-color: red !important;text-align: c;">highest</span> </td> <td style="text-align:left;"> <span style=" color: white !important;padding-right: 4px; padding-left: 4px; background-color: red !important;text-align: c;">highest</span> </td> </tr> <tr> <td style="text-align:left;"> Atl. mackerel-R </td> <td style="text-align:left;"> <span style=" color: black !important;padding-right: 4px; padding-left: 4px; background-color: yellow !important;text-align: c;">lowmod</span> </td> <td style="text-align:left;"> <span style=" color: black !important;padding-right: 4px; padding-left: 4px; background-color: lightgreen !important;text-align: c;">lowest</span> </td> <td style="text-align:left;"> <span style=" color: black !important;padding-right: 4px; padding-left: 4px; background-color: lightgreen !important;text-align: c;">lowest</span> </td> <td style="text-align:left;"> <span style=" color: black !important;padding-right: 4px; padding-left: 4px; background-color: lightgreen !important;text-align: c;">lowest</span> </td> <td style="text-align:left;"> <span style=" color: black !important;padding-right: 4px; padding-left: 4px; background-color: lightgreen !important;text-align: c;">lowest</span> </td> <td style="text-align:left;"> <span style=" color: black !important;padding-right: 4px; padding-left: 4px; background-color: yellow !important;text-align: c;">lowmod</span> </td> </tr> <tr> <td style="text-align:left;"> Atl. mackerel-C </td> <td style="text-align:left;"> <span style=" color: black !important;padding-right: 4px; padding-left: 4px; background-color: lightgreen !important;text-align: c;">lowest</span> </td> <td style="text-align:left;"> <span style=" color: black !important;padding-right: 4px; padding-left: 4px; background-color: yellow !important;text-align: c;">lowmod</span> </td> <td style="text-align:left;"> <span style=" color: black !important;padding-right: 4px; padding-left: 4px; background-color: orange !important;text-align: c;">modhigh</span> </td> <td style="text-align:left;"> <span style=" color: white !important;padding-right: 4px; padding-left: 4px; background-color: red !important;text-align: c;">highest</span> </td> <td style="text-align:left;"> <span style=" color: black !important;padding-right: 4px; padding-left: 4px; background-color: yellow !important;text-align: c;">lowmod</span> </td> <td style="text-align:left;"> <span style=" color: white !important;padding-right: 4px; padding-left: 4px; background-color: red !important;text-align: c;">highest</span> </td> </tr> <tr> <td style="text-align:left;"> Butterfish-C </td> <td style="text-align:left;"> <span style=" color: black !important;padding-right: 4px; padding-left: 4px; background-color: lightgreen !important;text-align: c;">lowest</span> </td> <td style="text-align:left;"> <span style=" color: black !important;padding-right: 4px; padding-left: 4px; background-color: yellow !important;text-align: c;">lowmod</span> </td> <td style="text-align:left;"> <span style=" color: black !important;padding-right: 4px; padding-left: 4px; background-color: orange !important;text-align: c;">modhigh</span> </td> <td style="text-align:left;"> <span style=" color: white !important;padding-right: 4px; padding-left: 4px; background-color: red !important;text-align: c;">highest</span> </td> <td style="text-align:left;"> <span style=" color: black !important;padding-right: 4px; padding-left: 4px; background-color: orange !important;text-align: c;">modhigh</span> </td> <td style="text-align:left;"> <span style=" color: black !important;padding-right: 4px; padding-left: 4px; background-color: lightgreen !important;text-align: c;">lowest</span> </td> </tr> <tr> <td style="text-align:left;"> Longfin squid-C </td> <td style="text-align:left;"> <span style=" color: black !important;padding-right: 4px; padding-left: 4px; background-color: lightgreen !important;text-align: c;">lowest</span> </td> <td style="text-align:left;"> <span style=" color: black !important;padding-right: 4px; padding-left: 4px; background-color: orange !important;text-align: c;">modhigh</span> </td> <td style="text-align:left;"> <span style=" color: white !important;padding-right: 4px; padding-left: 4px; background-color: red !important;text-align: c;">highest</span> </td> <td style="text-align:left;"> <span style=" color: white !important;padding-right: 4px; padding-left: 4px; background-color: red !important;text-align: c;">highest</span> </td> <td style="text-align:left;"> <span style=" color: white !important;padding-right: 4px; padding-left: 4px; background-color: red !important;text-align: c;">highest</span> </td> <td style="text-align:left;"> <span style=" color: black !important;padding-right: 4px; padding-left: 4px; background-color: yellow !important;text-align: c;">lowmod</span> </td> </tr> <tr> <td style="text-align:left;"> Shortfin squid-C </td> <td style="text-align:left;"> <span style=" color: black !important;padding-right: 4px; padding-left: 4px; background-color: yellow !important;text-align: c;">lowmod</span> </td> <td style="text-align:left;"> <span style=" color: black !important;padding-right: 4px; padding-left: 4px; background-color: yellow !important;text-align: c;">lowmod</span> </td> <td style="text-align:left;"> <span style=" color: black !important;padding-right: 4px; padding-left: 4px; background-color: yellow !important;text-align: c;">lowmod</span> </td> <td style="text-align:left;"> <span style=" color: black !important;padding-right: 4px; padding-left: 4px; background-color: yellow !important;text-align: c;">lowmod</span> </td> <td style="text-align:left;"> <span style=" color: black !important;padding-right: 4px; padding-left: 4px; background-color: lightgreen !important;text-align: c;">lowest</span> </td> <td style="text-align:left;"> <span style=" color: white !important;padding-right: 4px; padding-left: 4px; background-color: red !important;text-align: c;">highest</span> </td> </tr> <tr> <td style="text-align:left;"> Golden tilefish-R </td> <td style="text-align:left;"> <span style=" color: black !important;padding-right: 4px; padding-left: 4px; background-color: white !important;text-align: c;">na</span> </td> <td style="text-align:left;"> <span style=" color: black !important;padding-right: 4px; padding-left: 4px; background-color: lightgreen !important;text-align: c;">lowest</span> </td> <td style="text-align:left;"> <span style=" color: black !important;padding-right: 4px; padding-left: 4px; background-color: lightgreen !important;text-align: c;">lowest</span> </td> <td style="text-align:left;"> <span style=" color: black !important;padding-right: 4px; padding-left: 4px; background-color: lightgreen !important;text-align: c;">lowest</span> </td> <td style="text-align:left;"> <span style=" color: black !important;padding-right: 4px; padding-left: 4px; background-color: lightgreen !important;text-align: c;">lowest</span> </td> <td style="text-align:left;"> <span style=" color: black !important;padding-right: 4px; padding-left: 4px; background-color: lightgreen !important;text-align: c;">lowest</span> </td> </tr> <tr> <td style="text-align:left;"> Golden tilefish-C </td> <td style="text-align:left;"> <span style=" color: black !important;padding-right: 4px; padding-left: 4px; background-color: lightgreen !important;text-align: c;">lowest</span> </td> <td style="text-align:left;"> <span style=" color: black !important;padding-right: 4px; padding-left: 4px; background-color: lightgreen !important;text-align: c;">lowest</span> </td> <td style="text-align:left;"> <span style=" color: black !important;padding-right: 4px; padding-left: 4px; background-color: lightgreen !important;text-align: c;">lowest</span> </td> <td style="text-align:left;"> <span style=" color: black !important;padding-right: 4px; padding-left: 4px; background-color: lightgreen !important;text-align: c;">lowest</span> </td> <td style="text-align:left;"> <span style=" color: black !important;padding-right: 4px; padding-left: 4px; background-color: lightgreen !important;text-align: c;">lowest</span> </td> <td style="text-align:left;"> <span style=" color: black !important;padding-right: 4px; padding-left: 4px; background-color: lightgreen !important;text-align: c;">lowest</span> </td> </tr> <tr> <td style="text-align:left;"> Blueline tilefish-R </td> <td style="text-align:left;"> <span style=" color: black !important;padding-right: 4px; padding-left: 4px; background-color: lightgreen !important;text-align: c;">lowest</span> </td> <td style="text-align:left;"> <span style=" color: black !important;padding-right: 4px; padding-left: 4px; background-color: lightgreen !important;text-align: c;">lowest</span> </td> <td style="text-align:left;"> <span style=" color: black !important;padding-right: 4px; padding-left: 4px; background-color: lightgreen !important;text-align: c;">lowest</span> </td> <td style="text-align:left;"> <span style=" color: black !important;padding-right: 4px; padding-left: 4px; background-color: orange !important;text-align: c;">modhigh</span> </td> <td style="text-align:left;"> <span style=" color: black !important;padding-right: 4px; padding-left: 4px; background-color: lightgreen !important;text-align: c;">lowest</span> </td> <td style="text-align:left;"> <span style=" color: white !important;padding-right: 4px; padding-left: 4px; background-color: red !important;text-align: c;">highest</span> </td> </tr> <tr> <td style="text-align:left;"> Blueline tilefish-C </td> <td style="text-align:left;"> <span style=" color: black !important;padding-right: 4px; padding-left: 4px; background-color: lightgreen !important;text-align: c;">lowest</span> </td> <td style="text-align:left;"> <span style=" color: black !important;padding-right: 4px; padding-left: 4px; background-color: lightgreen !important;text-align: c;">lowest</span> </td> <td style="text-align:left;"> <span style=" color: black !important;padding-right: 4px; padding-left: 4px; background-color: lightgreen !important;text-align: c;">lowest</span> </td> <td style="text-align:left;"> <span style=" color: black !important;padding-right: 4px; padding-left: 4px; background-color: orange !important;text-align: c;">modhigh</span> </td> <td style="text-align:left;"> <span style=" color: black !important;padding-right: 4px; padding-left: 4px; background-color: lightgreen !important;text-align: c;">lowest</span> </td> <td style="text-align:left;"> <span style=" color: white !important;padding-right: 4px; padding-left: 4px; background-color: red !important;text-align: c;">highest</span> </td> </tr> <tr> <td style="text-align:left;"> Bluefish-R </td> <td style="text-align:left;"> <span style=" color: black !important;padding-right: 4px; padding-left: 4px; background-color: yellow !important;text-align: c;">lowmod</span> </td> <td style="text-align:left;"> <span style=" color: black !important;padding-right: 4px; padding-left: 4px; background-color: lightgreen !important;text-align: c;">lowest</span> </td> <td style="text-align:left;"> <span style=" color: black !important;padding-right: 4px; padding-left: 4px; background-color: lightgreen !important;text-align: c;">lowest</span> </td> <td style="text-align:left;"> <span style=" color: black !important;padding-right: 4px; padding-left: 4px; background-color: yellow !important;text-align: c;">lowmod</span> </td> <td style="text-align:left;"> <span style=" color: black !important;padding-right: 4px; padding-left: 4px; background-color: orange !important;text-align: c;">modhigh</span> </td> <td style="text-align:left;"> <span style=" color: white !important;padding-right: 4px; padding-left: 4px; background-color: red !important;text-align: c;">highest</span> </td> </tr> <tr> <td style="text-align:left;"> Bluefish-C </td> <td style="text-align:left;"> <span style=" color: black !important;padding-right: 4px; padding-left: 4px; background-color: lightgreen !important;text-align: c;">lowest</span> </td> <td style="text-align:left;"> <span style=" color: black !important;padding-right: 4px; padding-left: 4px; background-color: lightgreen !important;text-align: c;">lowest</span> </td> <td style="text-align:left;"> <span style=" color: black !important;padding-right: 4px; padding-left: 4px; background-color: yellow !important;text-align: c;">lowmod</span> </td> <td style="text-align:left;"> <span style=" color: black !important;padding-right: 4px; padding-left: 4px; background-color: yellow !important;text-align: c;">lowmod</span> </td> <td style="text-align:left;"> <span style=" color: black !important;padding-right: 4px; padding-left: 4px; background-color: yellow !important;text-align: c;">lowmod</span> </td> <td style="text-align:left;"> <span style=" color: white !important;padding-right: 4px; padding-left: 4px; background-color: red !important;text-align: c;">highest</span> </td> </tr> <tr> <td style="text-align:left;"> Spiny dogfish-R </td> <td style="text-align:left;"> <span style=" color: black !important;padding-right: 4px; padding-left: 4px; background-color: lightgreen !important;text-align: c;">lowest</span> </td> <td style="text-align:left;"> <span style=" color: black !important;padding-right: 4px; padding-left: 4px; background-color: lightgreen !important;text-align: c;">lowest</span> </td> <td style="text-align:left;"> <span style=" color: black !important;padding-right: 4px; padding-left: 4px; background-color: lightgreen !important;text-align: c;">lowest</span> </td> <td style="text-align:left;"> <span style=" color: black !important;padding-right: 4px; padding-left: 4px; background-color: lightgreen !important;text-align: c;">lowest</span> </td> <td style="text-align:left;"> <span style=" color: black !important;padding-right: 4px; padding-left: 4px; background-color: lightgreen !important;text-align: c;">lowest</span> </td> <td style="text-align:left;"> <span style=" color: black !important;padding-right: 4px; padding-left: 4px; background-color: lightgreen !important;text-align: c;">lowest</span> </td> </tr> <tr> <td style="text-align:left;"> Spiny dogfish-C </td> <td style="text-align:left;"> <span style=" color: black !important;padding-right: 4px; padding-left: 4px; background-color: lightgreen !important;text-align: c;">lowest</span> </td> <td style="text-align:left;"> <span style=" color: black !important;padding-right: 4px; padding-left: 4px; background-color: orange !important;text-align: c;">modhigh</span> </td> <td style="text-align:left;"> <span style=" color: black !important;padding-right: 4px; padding-left: 4px; background-color: orange !important;text-align: c;">modhigh</span> </td> <td style="text-align:left;"> <span style=" color: black !important;padding-right: 4px; padding-left: 4px; background-color: orange !important;text-align: c;">modhigh</span> </td> <td style="text-align:left;"> <span style=" color: black !important;padding-right: 4px; padding-left: 4px; background-color: yellow !important;text-align: c;">lowmod</span> </td> <td style="text-align:left;"> <span style=" color: black !important;padding-right: 4px; padding-left: 4px; background-color: orange !important;text-align: c;">modhigh</span> </td> </tr> <tr> <td style="text-align:left;"> Chub mackerel-C </td> <td style="text-align:left;"> <span style=" color: black !important;padding-right: 4px; padding-left: 4px; background-color: lightgreen !important;text-align: c;">lowest</span> </td> <td style="text-align:left;"> <span style=" color: black !important;padding-right: 4px; padding-left: 4px; background-color: yellow !important;text-align: c;">lowmod</span> </td> <td style="text-align:left;"> <span style=" color: black !important;padding-right: 4px; padding-left: 4px; background-color: yellow !important;text-align: c;">lowmod</span> </td> <td style="text-align:left;"> <span style=" color: black !important;padding-right: 4px; padding-left: 4px; background-color: yellow !important;text-align: c;">lowmod</span> </td> <td style="text-align:left;"> <span style=" color: black !important;padding-right: 4px; padding-left: 4px; background-color: lightgreen !important;text-align: c;">lowest</span> </td> <td style="text-align:left;"> <span style=" color: black !important;padding-right: 4px; padding-left: 4px; background-color: lightgreen !important;text-align: c;">lowest</span> </td> </tr> <tr> <td style="text-align:left;"> Unmanaged forage </td> <td style="text-align:left;"> <span style=" color: black !important;padding-right: 4px; padding-left: 4px; background-color: lightgreen !important;text-align: c;">lowest</span> </td> <td style="text-align:left;"> <span style=" color: black !important;padding-right: 4px; padding-left: 4px; background-color: lightgreen !important;text-align: c;">lowest</span> </td> <td style="text-align:left;"> <span style=" color: black !important;padding-right: 4px; padding-left: 4px; background-color: orange !important;text-align: c;">modhigh</span> </td> <td style="text-align:left;"> <span style=" color: black !important;padding-right: 4px; padding-left: 4px; background-color: lightgreen !important;text-align: c;">lowest</span> </td> <td style="text-align:left;"> <span style=" color: black !important;padding-right: 4px; padding-left: 4px; background-color: lightgreen !important;text-align: c;">lowest</span> </td> <td style="text-align:left;"> <span style=" color: black !important;padding-right: 4px; padding-left: 4px; background-color: lightgreen !important;text-align: c;">lowest</span> </td> </tr> <tr> <td style="text-align:left;"> Deepsea corals </td> <td style="text-align:left;"> <span style=" color: black !important;padding-right: 4px; padding-left: 4px; background-color: white !important;text-align: c;">na</span> </td> <td style="text-align:left;"> <span style=" color: black !important;padding-right: 4px; padding-left: 4px; background-color: white !important;text-align: c;">na</span> </td> <td style="text-align:left;"> <span style=" color: black !important;padding-right: 4px; padding-left: 4px; background-color: orange !important;text-align: c;">modhigh</span> </td> <td style="text-align:left;"> <span style=" color: black !important;padding-right: 4px; padding-left: 4px; background-color: white !important;text-align: c;">na</span> </td> <td style="text-align:left;"> <span style=" color: black !important;padding-right: 4px; padding-left: 4px; background-color: white !important;text-align: c;">na</span> </td> <td style="text-align:left;"> <span style=" color: black !important;padding-right: 4px; padding-left: 4px; background-color: white !important;text-align: c;">na</span> </td> </tr> </tbody> </table> --- ## How is MAFMC using the risk assessment? What's next? .pull-left[ * Based on risk assessment, the Council selected summer flounder as high-risk fishery for conceptual modeling  ] .pull-right[ * Working group of habitat, biology, stock assessment, management, economic and social scientists developed: * draft conceptual models of high risk elements, linkages * dataset identification and gap analysis for each element and link * draft questions that the Council could persue with additional work ] * Final conceptual model and supporting information at December 2019 Council meeting * Council to proceed with management strategy evaluation (MSE) using the information from conceptual modeling as a basis. Topic: addressing recreational fishery discards with EAFM --- <div id="htmlwidget-a8b356e055eeec0050d1" style="width:100%;height:710px;" class="widgetframe html-widget"></div> <script type="application/json" data-for="htmlwidget-a8b356e055eeec0050d1">{"x":{"url":"20200508_USCouncilUpdate_Gaichas_files/figure-html//widgets/widget_sfconceptmod.html","options":{"xdomain":"*","allowfullscreen":false,"lazyload":false}},"evals":[],"jsHooks":[]}</script> ??? In this interactive circular graph visualization, model elements identified as important by the Council (through risk assessment) and by the working group (through a range of experience and expertise) are at the perimeter of the circle. Elements are defined in detail in the last section of [this page](https://gdepiper.github.io/Summer_Flounder_Conceptual_Models/sfconsmod_riskfactors_subplots.html). Relationships between elements are represented as links across the center of the circle to other elements on the perimeter. Links from a model element that affect another element start wide at the base and are color coded to match the category of the element they affect.Hover over a perimeter section (an element) to see all relationships for that element, including links from other elements. Hover over a link to see what it connects. Links by default show text for the two elements and the direction of the relationship (1 for relationship, 0 for no relationship--most links are one direction).For example, hovering over the element "Total Landings" in the full model shows that the working group identified the elements affected by landings as Seafood Production, Recreational Value, and Commercial Profits (three links leading out from landings), and the elements affecting landings as Fluke SSB, Fluke Distributional Shift, Risk Buffering, Management Control, Total Discards, and Shoreside Support (6 links leading into Total Landings). --- ## New England Fishery Management Council Update .pull-left[ *2018 CIE for Ecosystem Based Fishery Management Strategy* * [EBFM strategy review](https://www.nefsc.noaa.gov/program_review/) * Multispecies model simulations   ] .pull-right[ *Current Draft example Fishery Ecosystem Plan* [eFEP](https://s3.amazonaws.com/nefmc.org/3_Draft-example-Fishery-Ecosystem-Plan-eFEP_190830_113712.pdf)  ] --- ## Mid-Atlantic EAFM next steps: management strategy evaluation * Spinning up in 2020-2021. Stay tuned! * Also embarking on a climate scenario planning exercise ## New England EBFM * Annual State of the Ecosystem reporting * Draft example Fishery Ecosystem Plan updates ongoing * Communications/outreach for the eFEP in progress * EBFM MSE in the future ## Atlantic States Marine Fisheries Commission * Ecosystem Reference Points for Atlantic menhaden + Using single species assessment and a suite of multispecies models + Passed peer review, additional analysis in May --- ## Conclusions Integrated ecosystem assessment is a valuable framework for the general implementation of ecosystem approaches to natural resource management * The Mid-Atlantic’s rapid progress in implementing EAFM resulted from positive collaboration between managers, stakeholders, and scientists. Collaboration is essential to IEA and to the success of EAFM. * Ecosystem indicators and reporting can be tailored to specific regional objectives. * Risk assessment is a rapid, familiar, scaleable, and transparent method to move forward with EAFM within a real-world operational fishery management context. * The Mid-Atlantic process highlights certain species and certain management issues as posing higher cumulative risks to meeting Council-derived management objectives when considering a broad range of ecological, social, and economic factors. * Conceptual modeling links the key factors for high risk fisheries and scopes more detailed integrated analysis and management strategy evaluation. ??? The Council foresees refining the process so that ecosystem indicators monitor risks to achieving ecological, social, and economic fishery objectives, which can then be mitigated through management action. --- ## If you want **all** the details * [Mid-Atlantic Council EAFM paper](https://www.frontiersin.org/articles/10.3389/fmars.2016.00105/full) * [Mid-Atlantic Council Risk Assessment paper](https://www.frontiersin.org/articles/10.3389/fmars.2018.00442/full#h11) * [Mid-Atlantic Council Summer Flounder conceptual model, support tables](https://gdepiper.github.io/Summer_Flounder_Conceptual_Models/sfconsmod_riskfactors_subplots.html) + [model and support tables page source code](https://github.com/gdepiper/Summer_Flounder_Conceptual_Models/blob/master/sfconsmod_riskfactors_subplots.Rmd) + [management questions and model page source code](https://github.com/gdepiper/Summer_Flounder_Conceptual_Models/blob/master/sfconsmod_final_2col.Rmd) * [Mid-Atantic April 2020 EAFM updates, including SOE](https://www.mafmc.org/s/Tab01_2020-SOE-Report_2020-04.pdf) * [New England April 2020 State of the Ecosystem](https://s3.amazonaws.com/nefmc.org/5b_SOE-NEFMC-2020-plus2pager.pdf) * [Atlantic States February 2020 Menhaden Summary](http://www.asmfc.org/uploads/file/5e5e84fbAtlanticMenhadenAssessmentsOverview_Feb2020.pdf) * Slides available at https://noaa-edab.github.io/presentations Scroll down to WGNARS --- class: inverse background-image: url("EDAB_images/IMG_2809.jpg") background-size: cover ## Questions? Thank you! .pull-left[ Contacts: ] .pull-right[ sarah.gaichas@noaa.gov geret.depiper@noaa.gov bmuffley@mafmc.org sean.lucey@noaa.gov ] --- ## Appendix: Why an ecosystem approach? *"We rebuilt all the stocks, so why is everyone still pissed off?" --Rich Seagraves* in 2011, the Mid-Atlantic Council asked: .pull-left[  ] .pull-right[  ] And many people answered, from commercial fishery, recreational fishery, environmental organization, and interested public perspectives. Visioning report: http://www.mafmc.org/s/MAFMC-stakeholder-input-report-p7b9.pdf --- ## Common themes among all stakeholder groups: >• There is a lack of confidence in the data that drive fishery management decisions. > >• Stakeholders are not as involved in the Council process as they can and should be. > >• Different jurisdictions and regulations among the many fishery management organizations result in complexity and inconsistency. > >• There is a need for increased transparency and communications in fisheries management. > >• The dynamics of the ecosystem and food web should be considered to a greater extent in fisheries management decisions. > >• Stakeholders are not adequately represented on the Council. > >• Pollution is negatively affecting the health of fish stocks. Visioning report, p. 3: http://www.mafmc.org/s/MAFMC-stakeholder-input-report-p7b9.pdf --- ## How did MAFMC develop their ecosystem approach? Visioning Project → Strategic Plan with one objective to develop >"A non-regulatory umbrella document intended to guide Council policy with respect to ecosystem considerations across existing Fishery Management Plans" .center[  ] Details, including workshop presentations and white papers: http://www.mafmc.org/eafm ??? The Mid-Atlantic Council identified several theme areas from the visioning project as noted in the left panel of the workflow graphic: forage fish, species interactions, social and economic issues, climate and habitat. The Council held full day workshops during Council meetings where experts on the topics provided overviews and Council members asked questions and discussed the issues. Workships on Forage fish, Climate, Climate and Governance, Interactions (species and fleet), and Habitat were held between 2013 and 2015, resulting in white papers on Forage fish, Climate (and habitat), Interactions (species, fleet, climate, and habitat). Social and economic considerations were integrated in each workshop rather than looked at separately. --- ## Web-based conceptual model presentation <div class="resp-container"> <iframe class="resp-iframe" title= "Conceptual model and management questions interactive page" src="https://gdepiper.github.io/Summer_Flounder_Conceptual_Models/sfconsmod_final_2col.html"></iframe> </div> .contrib[ https://gdepiper.github.io/Summer_Flounder_Conceptual_Models/sfconsmod_final_2col.html ]