class: right, middle, my-title, title-slide # What does math<br /> have to do with fish? ## Data, statistics, and modeling<br /> for management advice ### Sarah Gaichas<br /> Northeast Fisheries Science Center --- class: top, left .left-column-45[ # Outline * My path to NOAA * What is NOAA anyway? * What we do * Challenges with what we do * Addressing challenges: math! * Examples ] .right-column-45[ 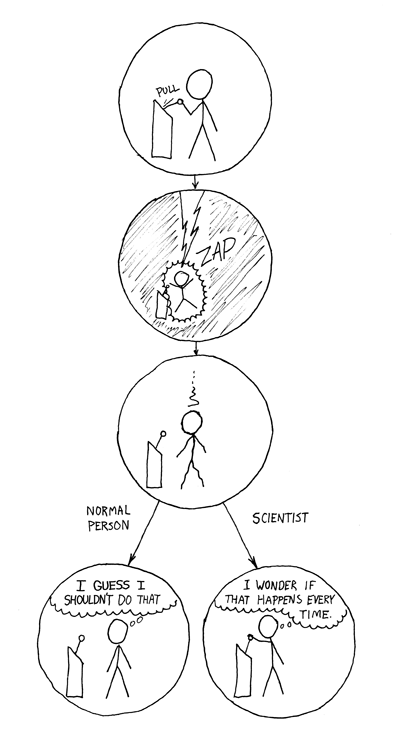 .center[https://xkcd.com/242/] ] --- background-image: url("EDAB_images/EnglishLitArt.png") background-size: 95% ## My (circuitous) path to NOAA -- .pull-left[  .center[   ] ] -- .pull-right[ 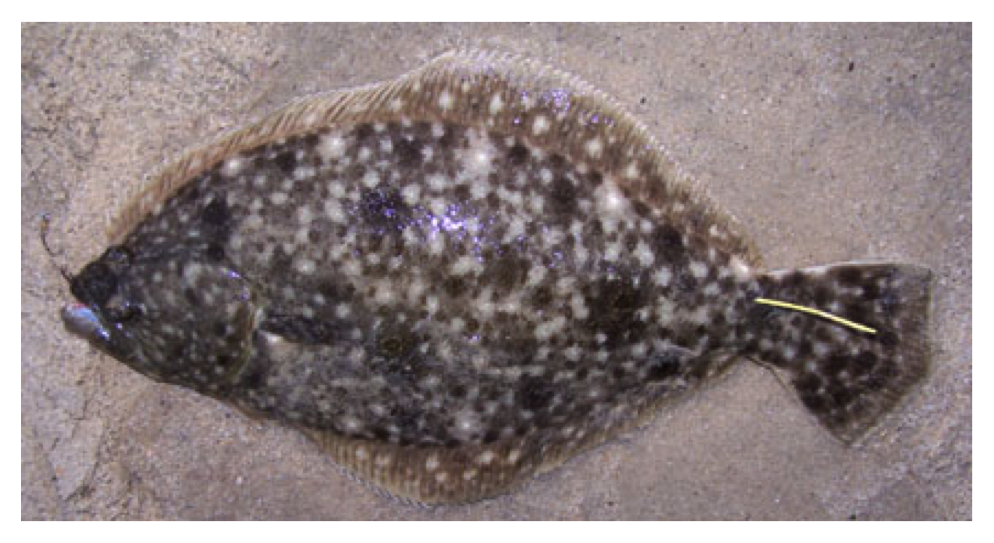 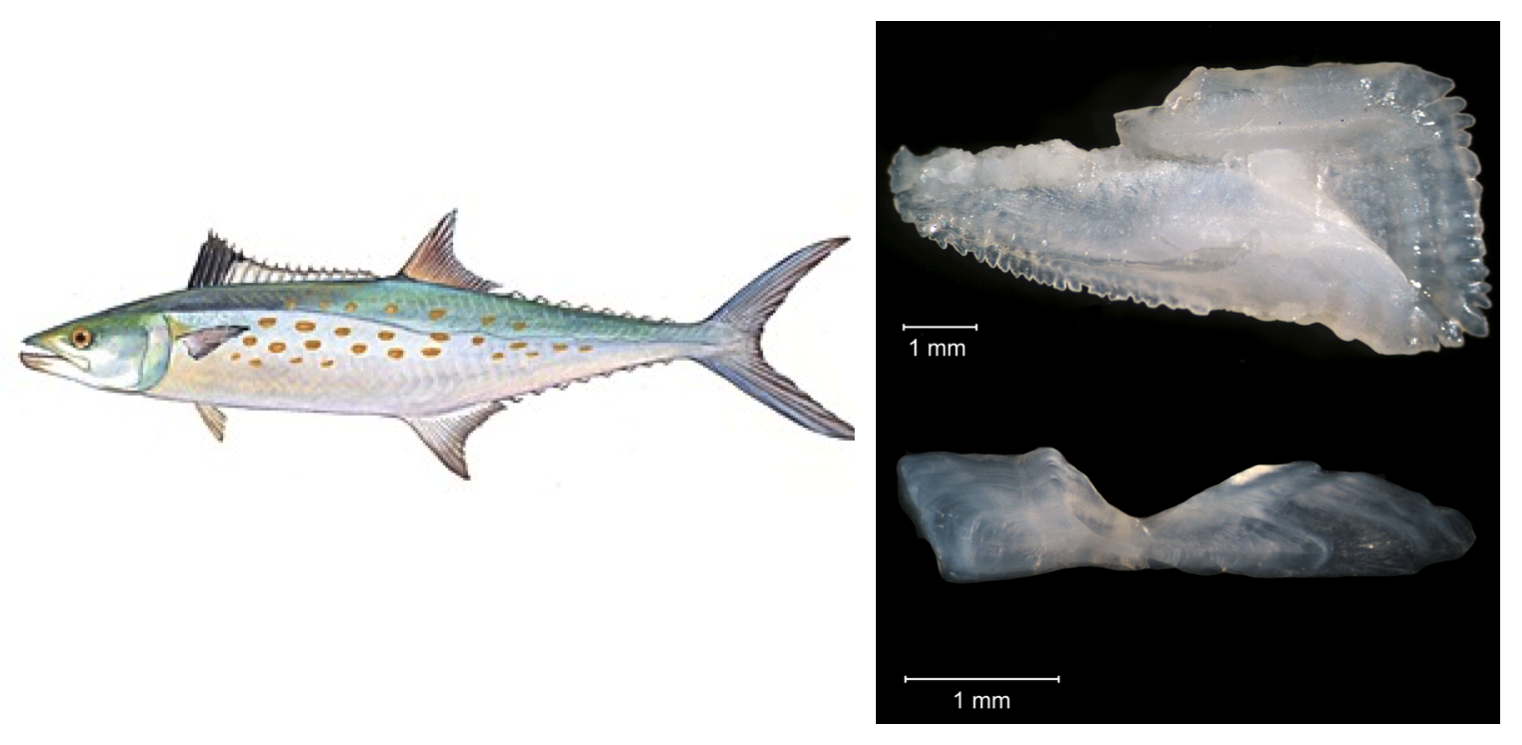 ] --- background-image: url("EDAB_images/NOAAtable.png") background-size: 95% 95% ## What is NOAA? -- 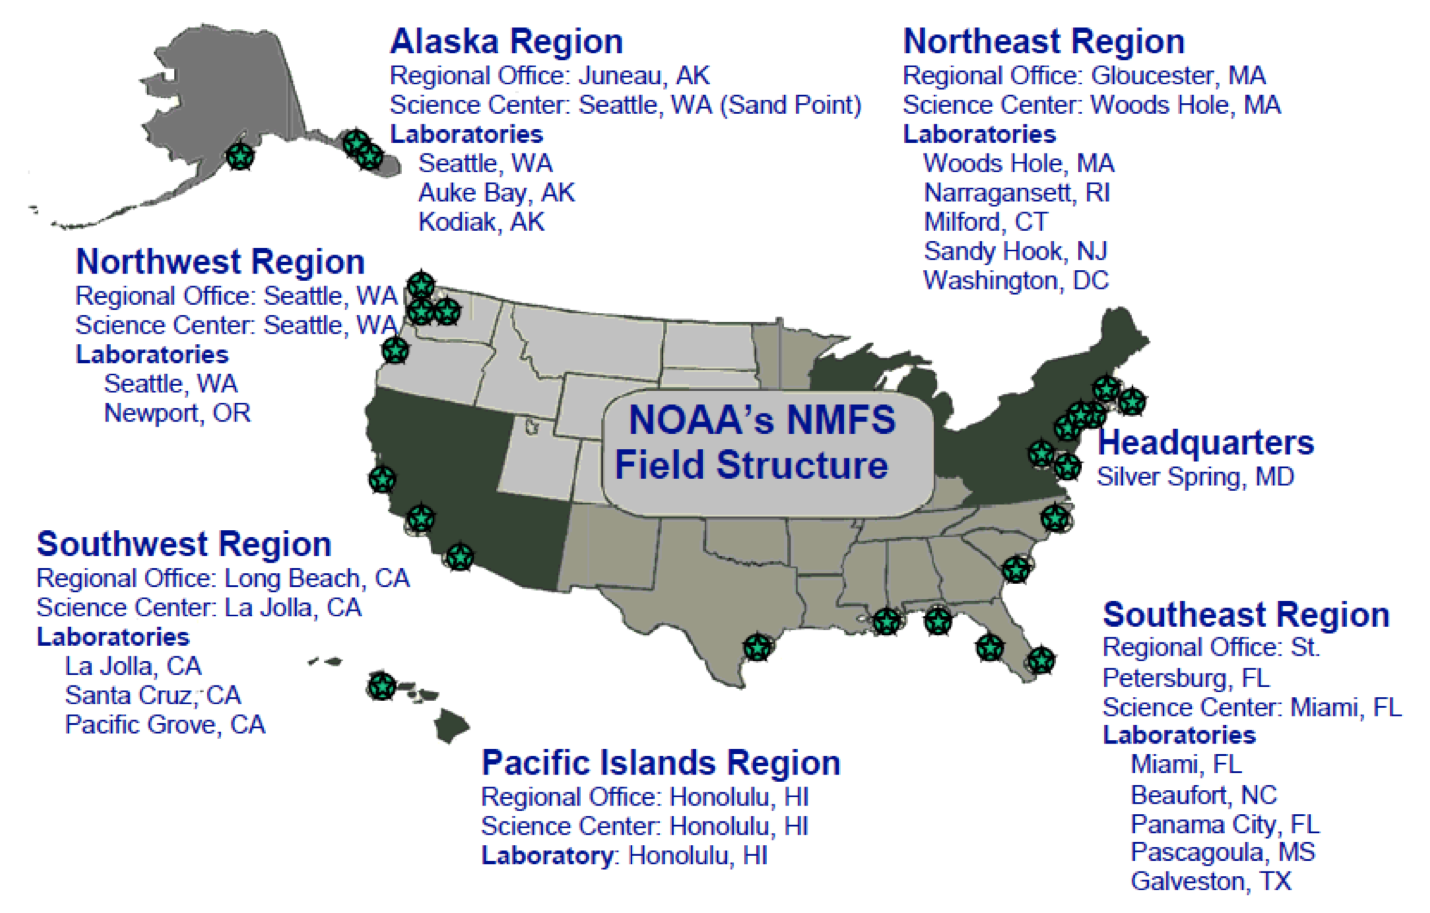 --- .left-column-45[ ## Working at NOAA Fisheries  ] .right-column-45[ Alaska: * Observer program analyst * Stock assessment + PhD at UW * Ecosystem modeling 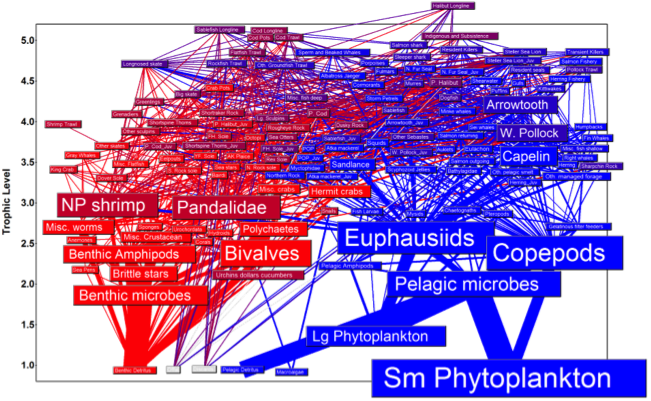 Northeast: * Integrated ecosystem assessment, management strategy evaluation 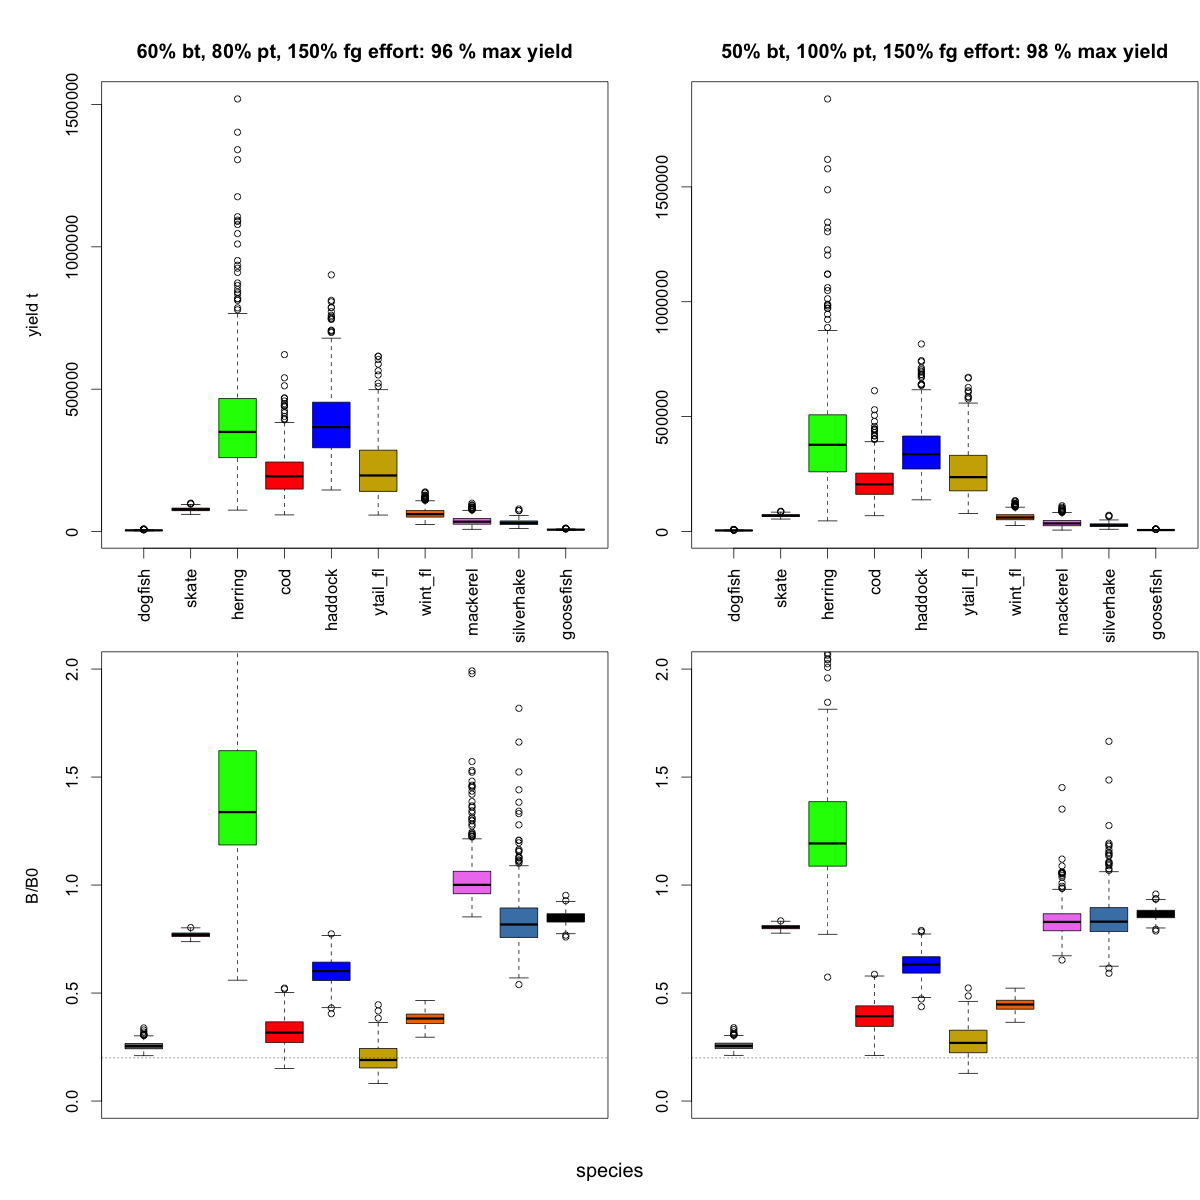 ] --- ## Fisheries: what do we need to know? **How many fish can be caught sustainably?** .pull-left[ * How many are caught right now? * How many were caught historically? * How many are there right now? * How many were there historically? * How productive are they (growth, reproduction)? ] .pull-right[ 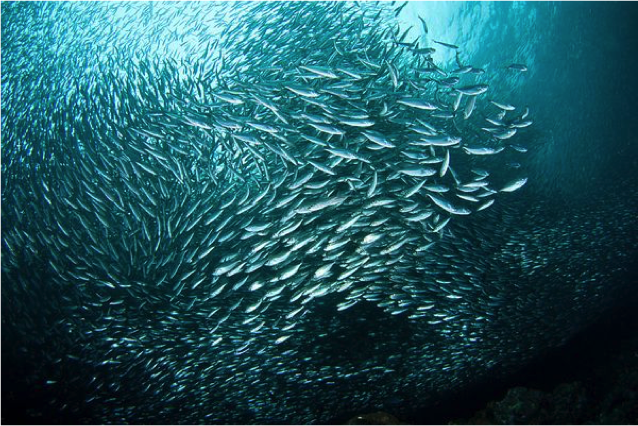 ] -- .bluetext[ * What supports their productivity? * What does their productivity support, besides fishing? * How do they interact with other fish, fisheries, marine animals? * How do environmental changes affect them? * What is their ecological, economic, and social value to people? ] --- ## Challenges addressed with math .pull-left[ * We don’t live in the ocean; can’t see or directly count what we manage * We know only basic biological properties of species; data are expensive * Catch coming to land is not the only fishing effect .bluetext[ * We manage species separately but they interact ] .bluetext[ * Different laws govern different species, activities ] .bluetext[ * People depend on these estimates for livelihoods ] ] -- .pull-right[ .greentext[ * Statistical design of surveys, sampling and estimation * Observation models for data * Sampling and estimation * Model structure and parameterization * Discarded catch estimation, habitat and other alterations * Multispecies and integrated assessment * Integrated assessment, management strategy evaluation * Validation, quality control, transparency ] ] --- background-image: url("EDAB_images/surveyvessels.png") background-size: cover ## Trawl surveys **How many fish are there now?** --- background-image: url("EDAB_images/AKgroundfish_insitu.png") background-size: cover --- background-image: url("EDAB_images/AFSCnetloft.png") background-size: contain --- background-image: url("EDAB_images/AKsurveytow.png") background-size: contain --- background-image: url("EDAB_images/AKsurveysort.png") background-size: contain --- ## What does math have to do with management?  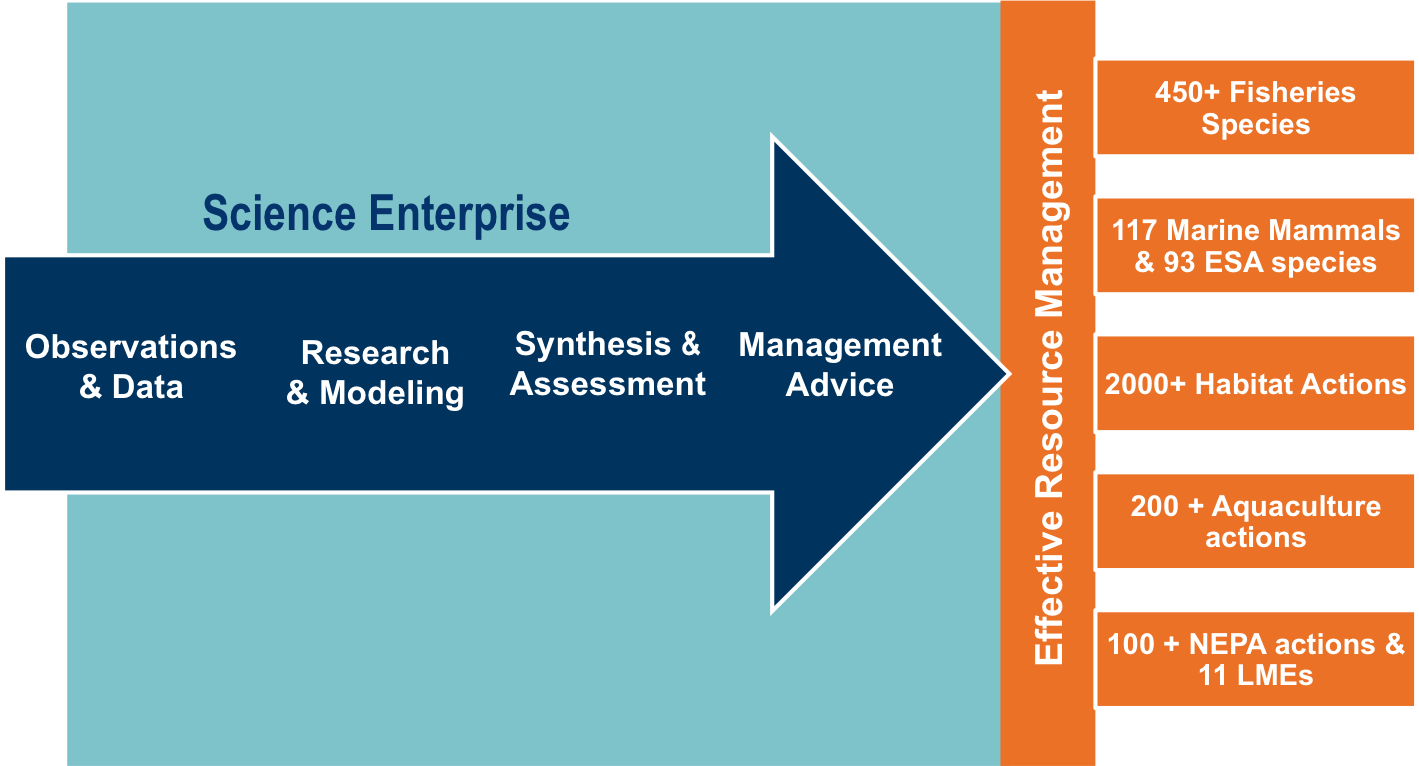 --- ## What kinds of models are there?  --- ## Components of assessment Prerequisite: research * Biology and ecology of the resource and its habitat * Improving observations and sampling .bluetext[ * Improving modeling and estimation methods ] Mathematical modeling * Population or ecosystem dynamics (numbers and or biomass) * Observation models: fishery catch and survey sampling .bluetext[ * Adding species interactions, climate and habitat effects ] Parameter estimation * Most often maximum likelihood, Bayesian increasingly common .bluetext[ * Search algorithms needed for high dimensional space * Genetic algorithms, others in testing ] Forecasting (1-3 years out) * Predictions depend on modeled and unmodeled processes * Characterize uncertainty --- ## Math, models, and fisheries--examples 1. Prologue: What is a "forage fish"? 1. Pacific sardine: stock assessment performance testing .bluetext[*"How does climate change affect our stock assessments?"*] - Overview of stock assessment process - Testing a real assessment model with fake (but known!) "data" 1. Atlantic herring: fishery management strategy evaluation .bluetext[*"Which harvest control rules best consider herring's role as forage?"*] - Balancing fishing benefits and ecological services - Diverse stakeholder interests - Needed timely answers! 1. Epilogue: Integrated ecosystem assessment * (Appendix) Alaska pollock: ecological research with a food web model .bluetext[*"How does ecosystem structure affect dynamics?"*] - Distinguishing climate, fishing, and food web interactions - Dealing with uncertainty --- ## 1. Prologue: What is a forage fish? <img src="EDAB_images/forageSeattleTimes.png" width="67%" style="display: block; margin: auto;" /> --- ## 2. How does climate change affect our stock assessments? .pull-left[ - Changing climate and ocean conditions → Shifting species distributions, changing productivity - Needs: - Improve our ability to project global change impacts in the California Current and Nordic/Barents Seas (and elsewhere) - Test the performance of stock assessments to these impacts ] .pull-right[ *Climate-Ready Management<sup>1</sup>*  ] .footnote[ [1] Karp, Melissa A. et al. 2019. Accounting for shifting distributions and changing productivity in the development of scientific advice for fishery management. – ICES Journal of Marine Science, doi:10.1093/icesjms/fsz048. ] ??? --- ## Virtual worlds: end-to-end ecosystem models Atlantis modeling framework: [Fulton et al. 2011](https://onlinelibrary.wiley.com/doi/full/10.1111/j.1467-2979.2011.00412.x), [Fulton and Smith 2004](https://www.ajol.info/index.php/ajms/article/view/33182) .pull-left[ **Norwegian-Barents Sea** [Hansen et al. 2016](https://www.imr.no/filarkiv/2016/04/fh-2-2016_noba_atlantis_model_til_web.pdf/nn-no), [2018](https://journals.plos.org/plosone/article?id=10.1371/journal.pone.0210419)  ] .pull-right[ **California Current** [Marshall et al. 2017](https://onlinelibrary.wiley.com/doi/full/10.1111/gcb.13594), [Kaplan et al. 2017](https://www.sciencedirect.com/science/article/pii/S0304380016308262?via%3Dihub)  ] Building on global change projections: [Hodgson et al. 2018](https://www.sciencedirect.com/science/article/pii/S0304380018301856?via%3Dihub), [Olsen et al. 2018](https://www.frontiersin.org/articles/10.3389/fmars.2018.00064/full) ??? --- ## Design: Ecosystem model scenario (climate and fishing) <img src="EDAB_images/projectionOMsetup.png" width="85%" style="display: block; margin: auto;" /> -- .pull-left[ * Recruitment variability in the operating model * Specify uncertainty in assessment inputs using `atlantisom` ] .pull-right[  ] --- ## What can we do so far? .pull-left[ Survey census test NOBA <img src="EDAB_images/NOBAcensus.png" width="1792" style="display: block; margin: auto;" /> True length composition NOBA <img src="EDAB_images/NOBAherringtruelf.png" width="1792" style="display: block; margin: auto;" /> ] .pull-right[ Standard survey test CCA <img src="EDAB_images/CCsurveyex.png" width="1792" style="display: block; margin: auto;" /> Survey length composition CCA <img src="EDAB_images/CCV3herringlfcomp.png" width="1792" style="display: block; margin: auto;" /> ] --- ## A "sardine" assessment Need: assessment model data inputs and life history parameters *(model based on actual Sardine assessment in Stock Synthesis 3)* .pull-left[ Data: * survey biomass index * survey length composition * survey age composition (conditional catch at age) * fishery catch (tons) * fishery length composition * fishery age composition ] .pull-right[ Parameters: * natural mortality (from total mortality) * growth curve (from survey length at age) * maturity at age (true) * unfished recruitment and steepness (true) * weight-length curve (true) ] `\(N_{t+1,a} = \left\{\begin{array}{ll}R_{t+1} \\(N_{t,a}e^{-M/2} - C_{t,a})e^{-M/2} \\(N_{t,x-1}e^{-M/2} - C_{t,x-1})e^{-M/2} + (N_{t,x}e^{-M/2} - C_{t,x})e^{-M/2}\end{array}\right.\)` --- ## A "sardine" assessment: setup * California Current Atlantis run with and without climate signal * Input data generated (e.g. sardine survey, below in green) * Parameters derived; simpler recruitment distribution <img src="EDAB_images/CCsurvObsBiom.png" width="90%" style="display: block; margin: auto auto auto 0;" /> --- ## A "sardine" assessment: fits to data .pull-left[   ] .pull-right[   ] --- ## A "sardine" assessment: skill? (proof of concept) .pull-left[ Biomass <img src="EDAB_images/trueBss3B.png" width="1792" style="display: block; margin: auto;" /> Fishing mortality <img src="EDAB_images/trueFss3F.png" width="1792" style="display: block; margin: auto;" /> ] .pull-right[ Recruitment <img src="EDAB_images/trueRss3R.png" width="1792" style="display: block; margin: auto;" /> Key: <span style="color:teal">True</span> <span style="color:red">SS3 estimate</span> ] --- ## Assessment performance under climate: in progress .pull-left-60[ Still working on: 1. Functions for more detailed assessments 1. Splitting aggregate age groups into true ages 1. Interpolating aggregate age groups weight at age for true ages 1. Fishery catch weight by area 1. Wrapper functions to generate data in fewer steps 1. Automated skill assessment functions 1. Inputs for other common assessment models ] .pull-right-40[  ] --- ## 3. Are any Atlantic herring harvest control rules good for both fisheries and predators? <img src="EDAB_images/allcomponents.png" width="1701" /> --- ## What is Management Strategy Evaluation? <img src="EDAB_images/MSECSIRO.png" width="2000" /> --- ## The Dream and The Reality <img src="EDAB_images/MgtProcess.png" width="1824" /> --- ## Design: link models matching stakeholder-identified objectives <img src="EDAB_images/OMdesign.png" width="85%" style="display: block; margin: auto;" /> ## Design: multiple (herring) operating models spanning uncertainty --- ## Economics: more data, models, assessments! - The dream: predator response links to ecosystem services, human well being - Fishery complexity rivals or exceeds that of food webs! .pull-left[  ] .pull-right[  ] --- ## Predators <img src="EDAB_images/herrtopreds.png" width="1848" /> --- ## Seabirds: data collected throughout Gulf of Maine .pull-left[  ] .pull-right[  ] - Colony adult and fledgling count data used to develop population model - Chick diet observations examined in relation to fledgling success The overall population in numbers for each predator `\(P\)` each year `\(N_{y}^P\)` is modeled with a delay-difference function, where annual predator survival `\(S_{y}^P\)` is based on annual natural mortality `\(v\)` and exploitation `\(u\)`: `\(N_{y+1}^P = N_{y}^PS_{y}^P + R_{y+1}^P\)` ; `\(S_{y}^P = (1-v_{y})(1-u)\)` , and annual recruitment `\(R_{y}^P\)` (at recruitment age a) is a Beverton-Holt function. --- ## Terns and herring--developing a modeled relationship .pull-left[  ] .pull-right[  ] No clear significant relationships of common tern productivity and the proportion of herring in diets across all colonies, there were some correlations between herring total biomass and tern productivity. This relationship (right plot) was developed to relate herring biomass to common tern productivity (recruitment): .center[ `\(\bar{R}_{y+a}^P = R_{y+a}^P * \frac{\gamma(N_{y}/N_{thresh})}{(\gamma-1)+(N_{y}/N_{thresh})}\)` ] --- ## Testing the model--does it work?  --- ## Predator results summary <img src="EDAB_images/herrtopreds_results.png" width="1833" /> Three control rule types--Constant catch, conditional constant catch, and 15% restriction on change--were rejected at the second stakeholder meeting for poor fishery and predator performance. --- ## What control rules give us 90% of everything we want? - Tern productivity at 1.0 or above more than 90% of the time - Herring biomass more than 90% of SSBmsy - Fishery yield more than 90% of MSY - AND fishery closures (F=0) less than 1% of the time (second plot). .pull-left[ <!-- --> ] .pull-right[ <!-- --> ] --- ## Food web modeling; supplemental results  Tradeoffs between forage groups apparent --- ## What have we learned? Data-backed models allow us to test options .pull-left-30[ Complex food web, generalist predators - Herring is one of several important prey - Assessing multiple prey together will likely show stronger effects on predator productivity ] .pull-right-70[  ] - Tern/Tuna/Groundfish/Mammal productivity is also affected by predators, weather, and other factors not modeled here - Even relatively weak relationships still showed which herring control rules were poor - Managers did select a harvest control rule considering a wide range of factors! --- ## 4. Epilogue: integrated ecosystem assessment .pull-left[ - Establish objectives - Develop indicatprs - Assess ecosystem - Risk assessment - Management strategy evaluation - Evaluate and iterate  ] .pull-right[ *The IEA Loop<sup>1</sup>*  ] .footnote[ [1] https://www.integratedecosystemassessment.noaa.gov/national/IEA-approach ] ??? --- ## Indicator example: Marine heatwaves in the Mid-Atlantic **New Indicator 2020** .center[  ] .pull-left[  ] .pull-right[  ] --- ## Collaborators - THANK YOU! The New England and Mid-Atlantic State of the Ecosystem reports made possible by (at least) 38 contributors from 8 intstitutions .pull-left[ .contrib[ Donald Anderson (Woods Hole Oceanographic Institute) <br> Andy Beet<br> Patricia Clay<br> Lisa Colburn<br> Geret DePiper<br> Michael Fogarty<br> Paula Fratantoni <br> Kevin Friedland<br> Sarah Gaichas<br> Avijit Gangopadhyay (School for Marine Science and Technology, University of Massachusetts Dartmouth)<br> James Gartland (Virginia Institute of Marine Science)<br> Glen Gawarkiewicz (Woods Hole Oceanographic Institution)<br> Sean Hardison<br> Kimberly Hyde<br> Terry Joyce (Woods Hole Oceanographic Institute)<br> John Kocik<br> Steve Kress (National Audubon Society)<br> Scott Large ] ] .pull-right[ .contrib[ Don Lyons (National Audubon Society)<br> Ruth Boettcher (Virginia Department of Game and Inland Fisheries)<br> Young-Oh Kwon (Woods Hole Oceanographic Institution)<br> Zhuomin Chen (Woods Hole Oceanographic Institution)<br> Sean Lucey<br> Chris Melrose<br> Ryan Morse<br> Kimberly Murray<br> Chris Orphanides<br> Richard Pace<br> Charles Perretti<br> Vincent Saba<br> Laurel Smith<br> Mark Terceiro<br> John Walden<br> Harvey Walsh<br> Mark Wuenschel ] ] .center[  ] --- # Multiple objectives, multiple challenges Fisheries stock assessment and ecosystem modeling continue to develop .bluetext[Can we keep pace with climate?] Existing management systems are at least as complex as the ecosystems, with diverse interests and emerging industries .pull-left[ Integrated ecosystem assessment and management strategy evaluation * Include key interactions + Species + Fisheries * Environment * Make tradeoffs explicit * Account for uncertainty .bluetext[Mathematical innovation needed!] ] .pull-right[  ] --- ## If you want more details * [2: Atlantis Model Documentation](https://github.com/Atlantis-Ecosystem-Model/Atlantis_example_and_instructions) * [2: atlantisom R package in progress](https://github.com/r4atlantis/atlantisom) * [2: Testing atlantisom in progress](https://github.com/sgaichas/poseidon-dev) * [3: New England herring MSE modeling paper](https://www.nrcresearchpress.com/doi/10.1139/cjfas-2018-0128#.XTb_c5NKgWo) * [3: New England herring MSE stakeholder process paper](https://www.nrcresearchpress.com/doi/abs/10.1139/cjfas-2018-0125#.XTb_v5NKgWo) * [4: NOAA State of the Ecosystem summary webpage](https://www.fisheries.noaa.gov/new-england-mid-atlantic/ecosystems/state-ecosystem-reports-northeast-us-shelf) * [4: State of the Ecosystem Technical Documentation](https://noaa-edab.github.io/tech-doc) * [4: ecodata R package](https://github.com/noaa-edab/ecodata) * [Appendix: Wasp Waist or Beer Belly?](https://www.sciencedirect.com/science/article/pii/S0079661115002001) * Slides available at https://noaa-edab.github.io/presentations --- background-image: url("EDAB_images/SOE_feature_image.png") background-size: contain .footnote[Questions? Thank you!] --- ## Appendix 1. How does ecosystem structure affect dynamics? 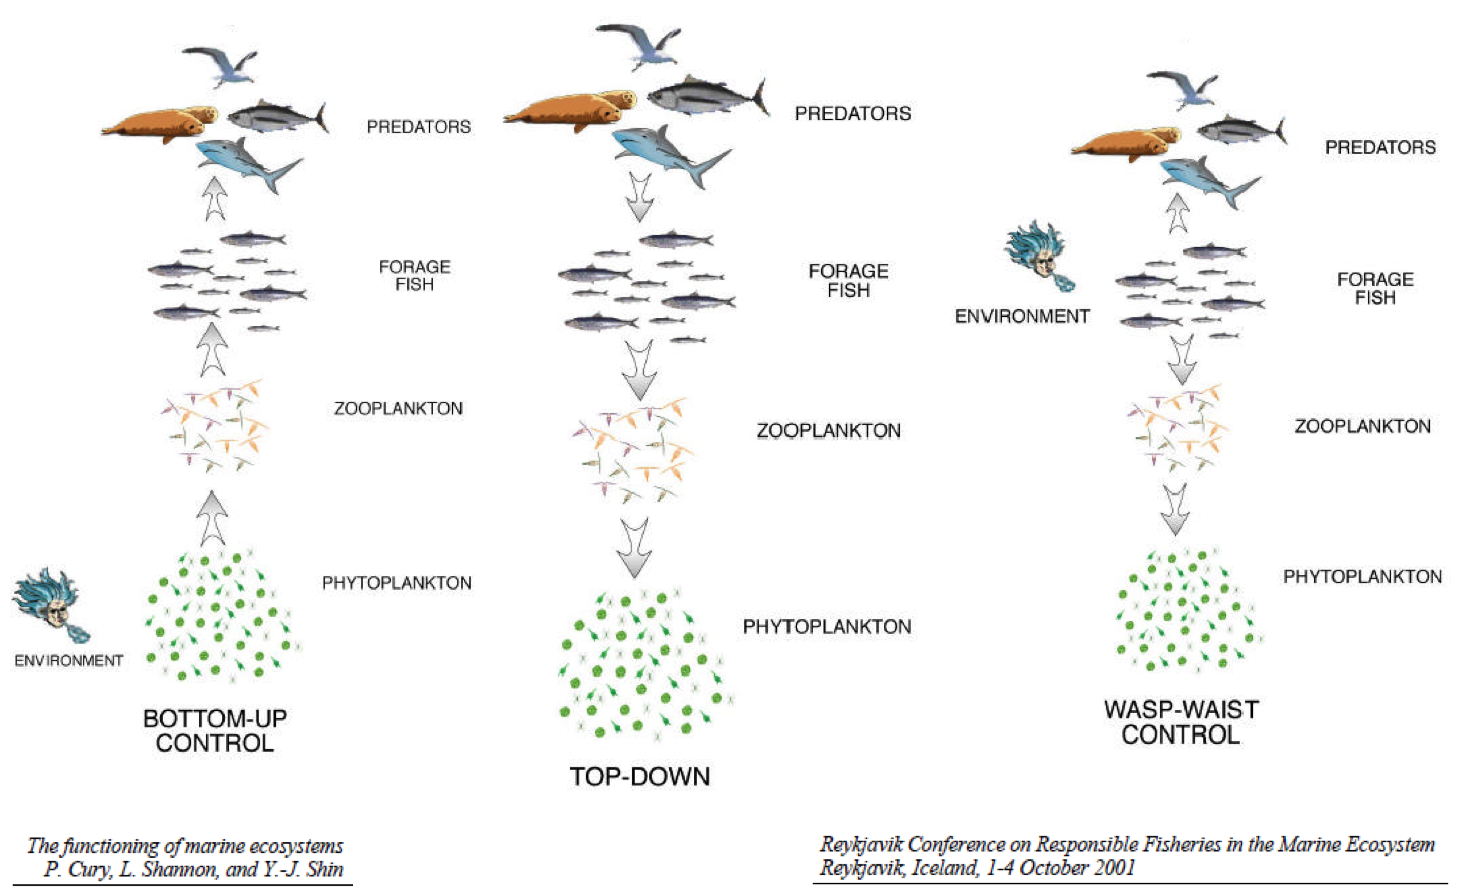 --- ## Alaska pollock: a tale of two ecosystems 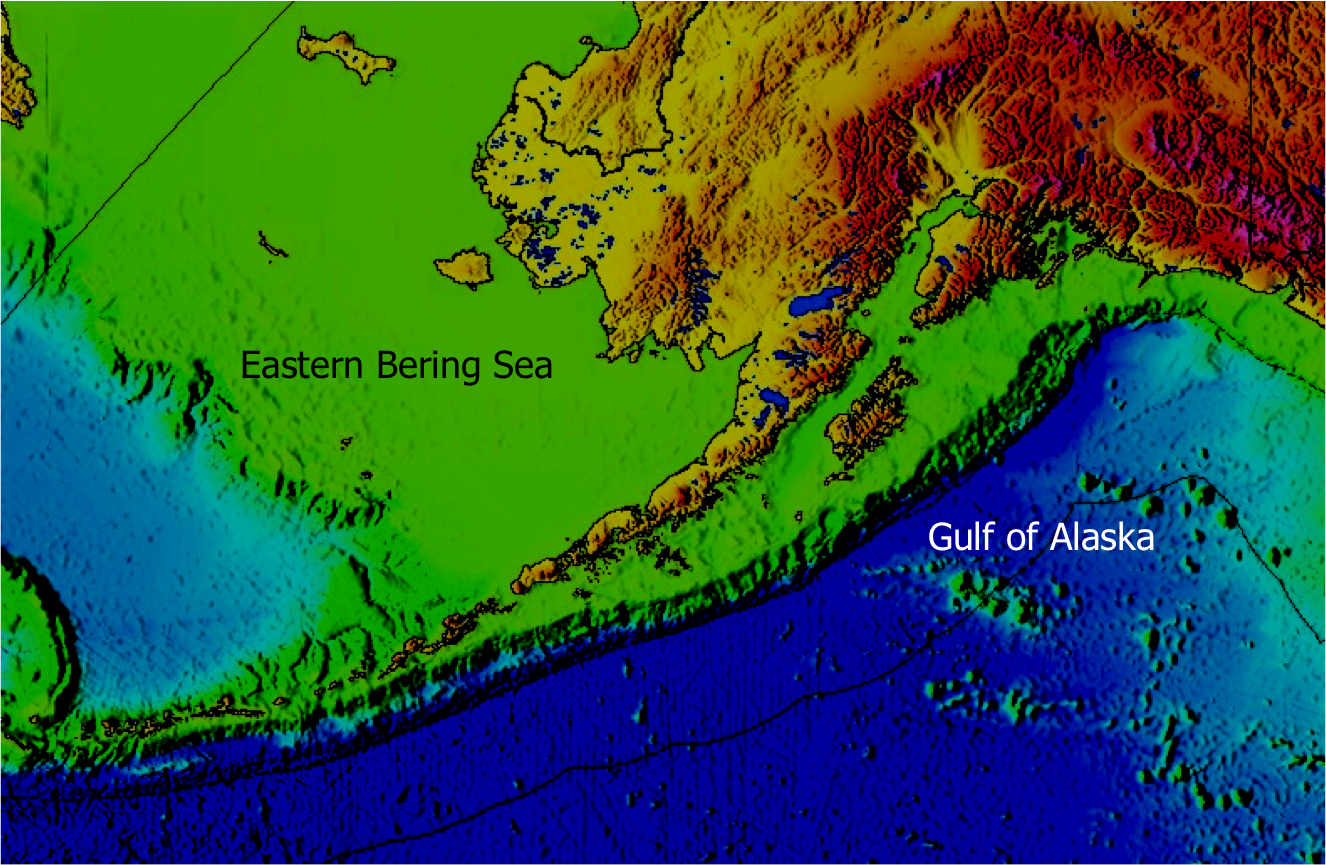 --- ## Alaska pollock: a tale of two ecosystems 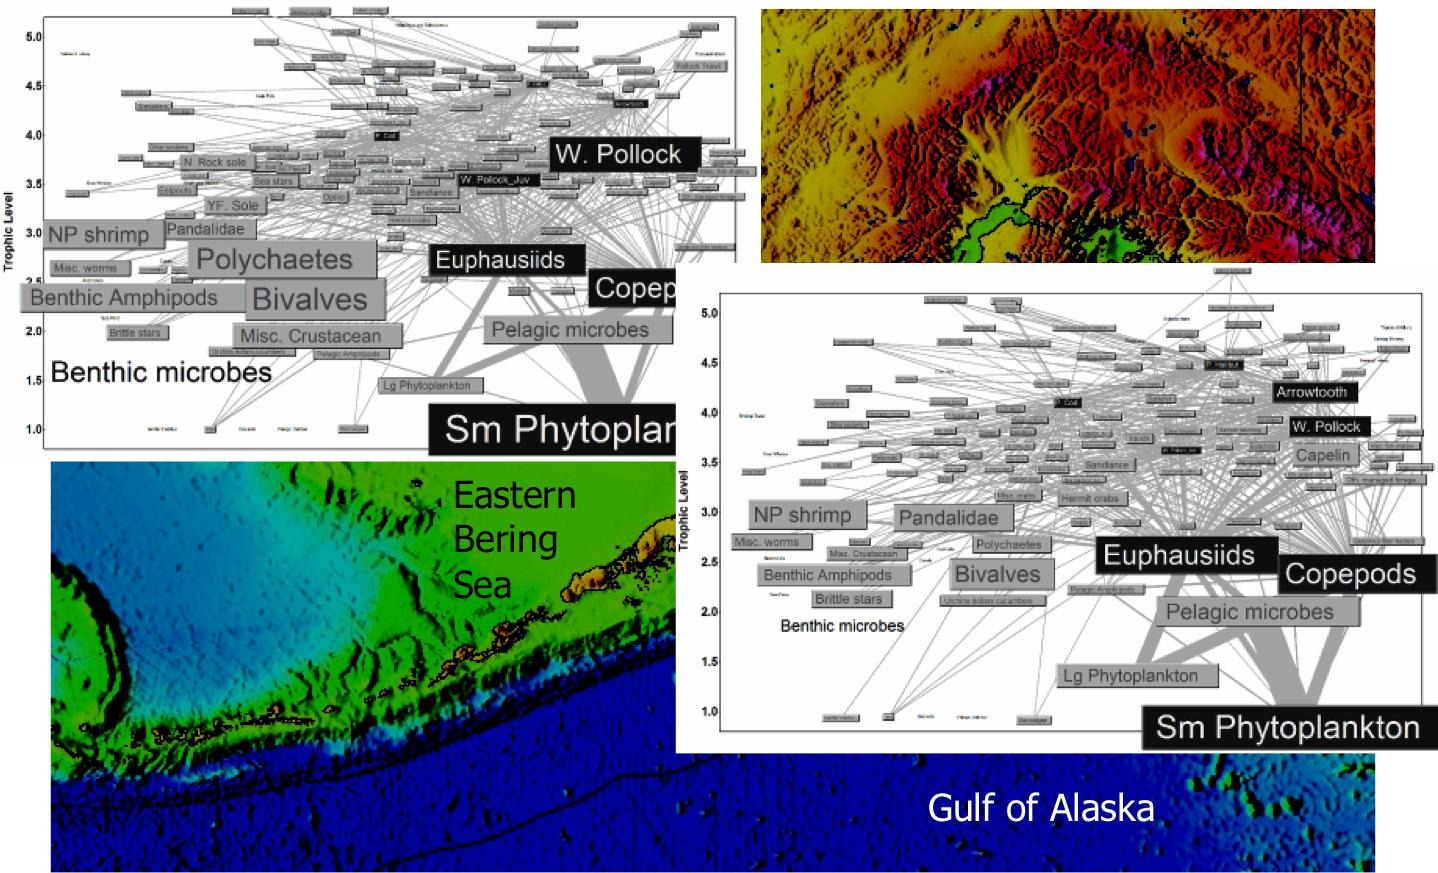 --- ## Alaska pollock: a tale of two ecosystems .pull-left[ - Different pollock trajectories - Different pollock diets, mortality sources <img src="EDAB_images/pollpic.png" width="85%" style="display: block; margin: auto;" /> ] .pull-right[ <img src="EDAB_images/EBSGOApollassess.png" width="95%" style="display: block; margin: auto;" /> ] <img src="EDAB_images/EBSGOApolldietmort.png" width="95%" style="display: block; margin: auto;" /> ??? diets:- copepods, krill, pollock in EBS - krill, shrimp, some copepods in GOA --- ## Ecosystem models and uncertainty 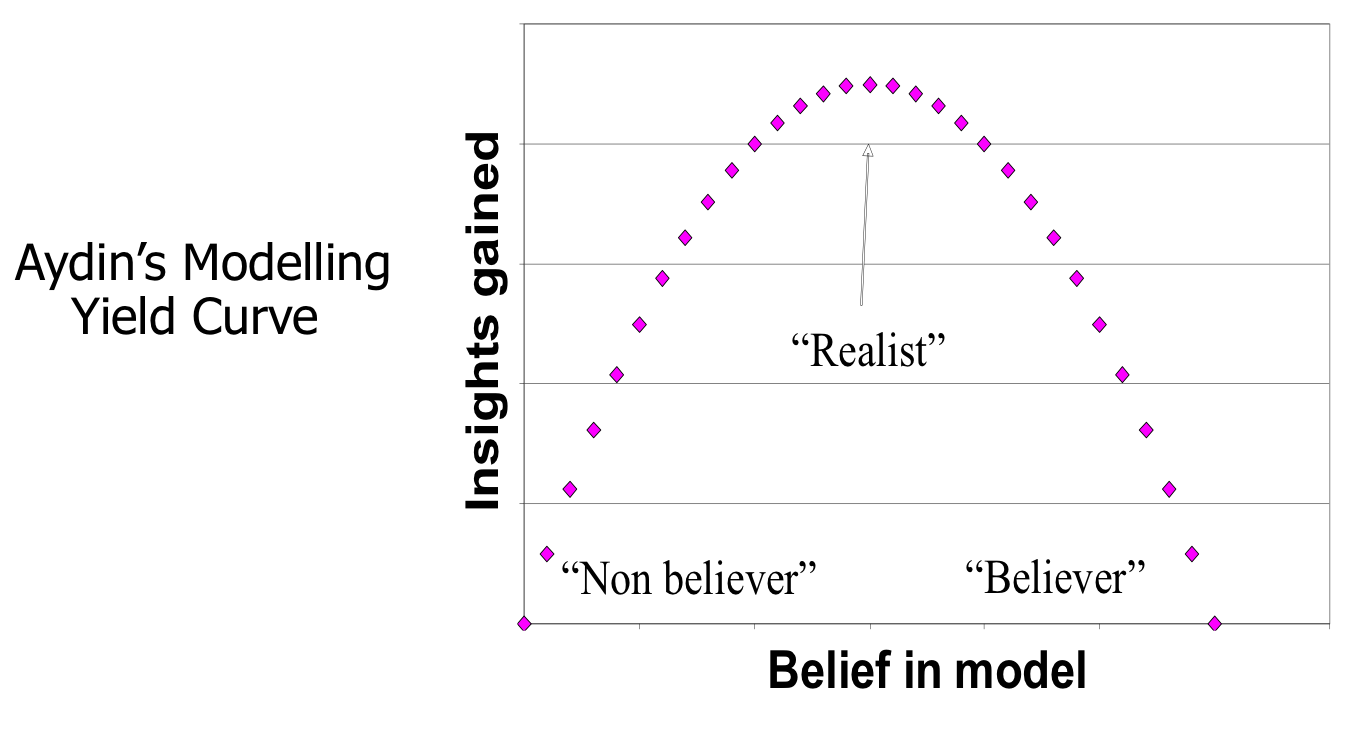 --- ## Model ensemble https://xkcd.com/1885/ 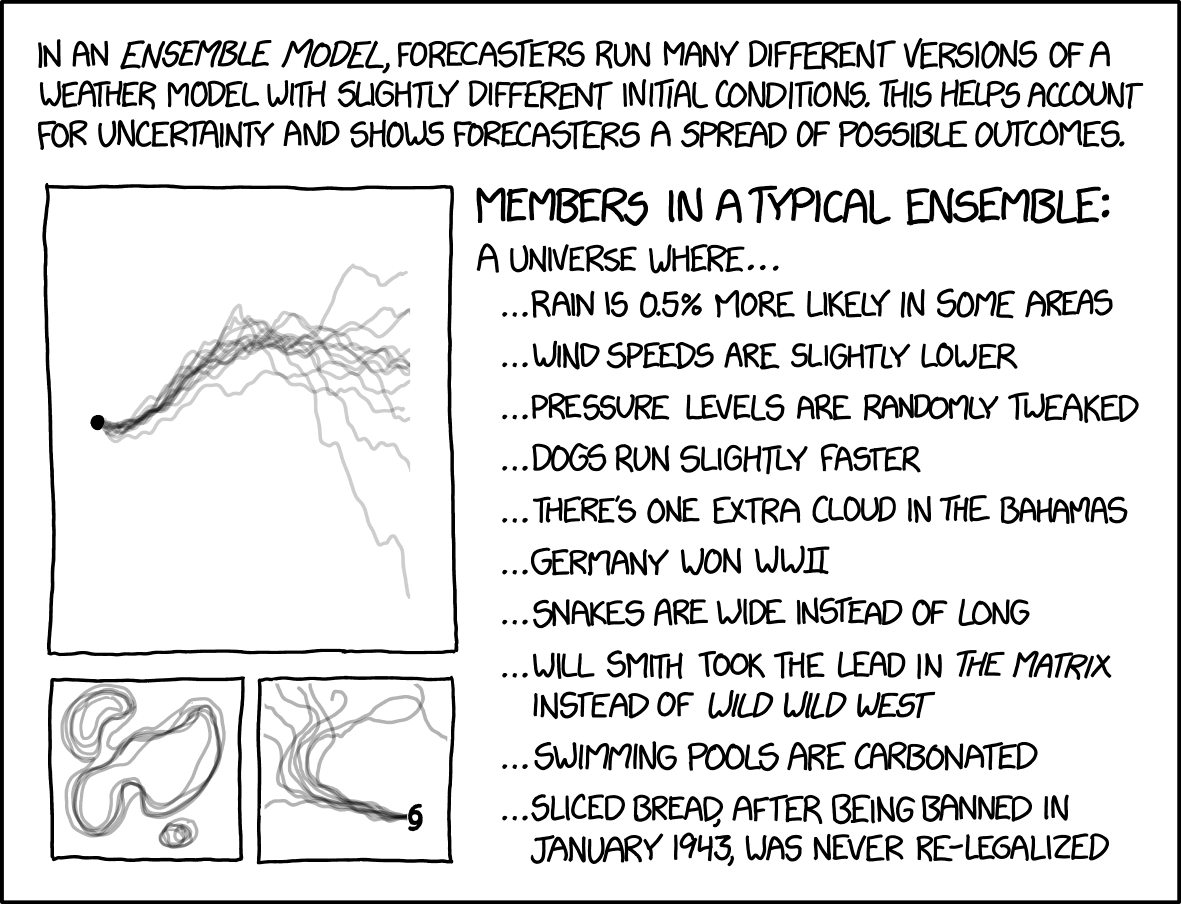 --- ## What is a food web model? .pull-left-60[ A system of linear equations For each group, `\(i\)`, specify: Biomass `\(B\)` [or Ecotrophic Efficiency `\(EE\)` ] Population growth rate `\(\frac{P}{B}\)` Consumption rate `\(\frac{Q}{B}\)` Diet composition `\(DC\)` Fishery catch `\(C\)` Biomass accumulation `\(BA\)` Im/emigration `\(IM\)` and `\(EM\)` Solving for `\(EE\)` [or `\(B\)` ] for each group: ] .pull-right-40[ 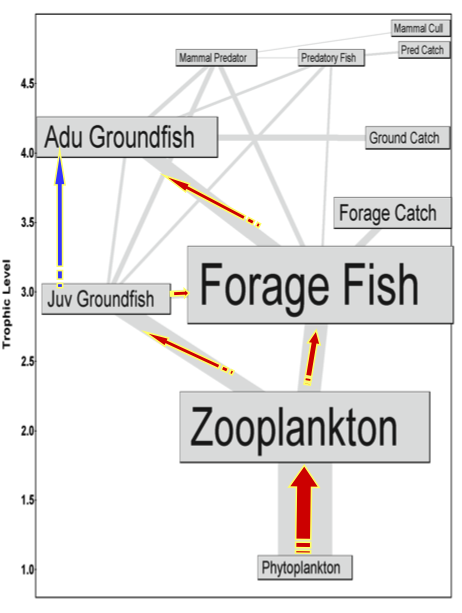 ] `$$B_i\Big(\frac{P}{B}\Big)_i*EE_i+IM_i+BA_i=\sum_{j}\Big[ B_j\Big (\frac{Q}{B}\Big)_j*DC_{ij}\Big ]+EM_i+C_i$$` ??? --- ## Ecosystem models and uncertainty: grading inputs 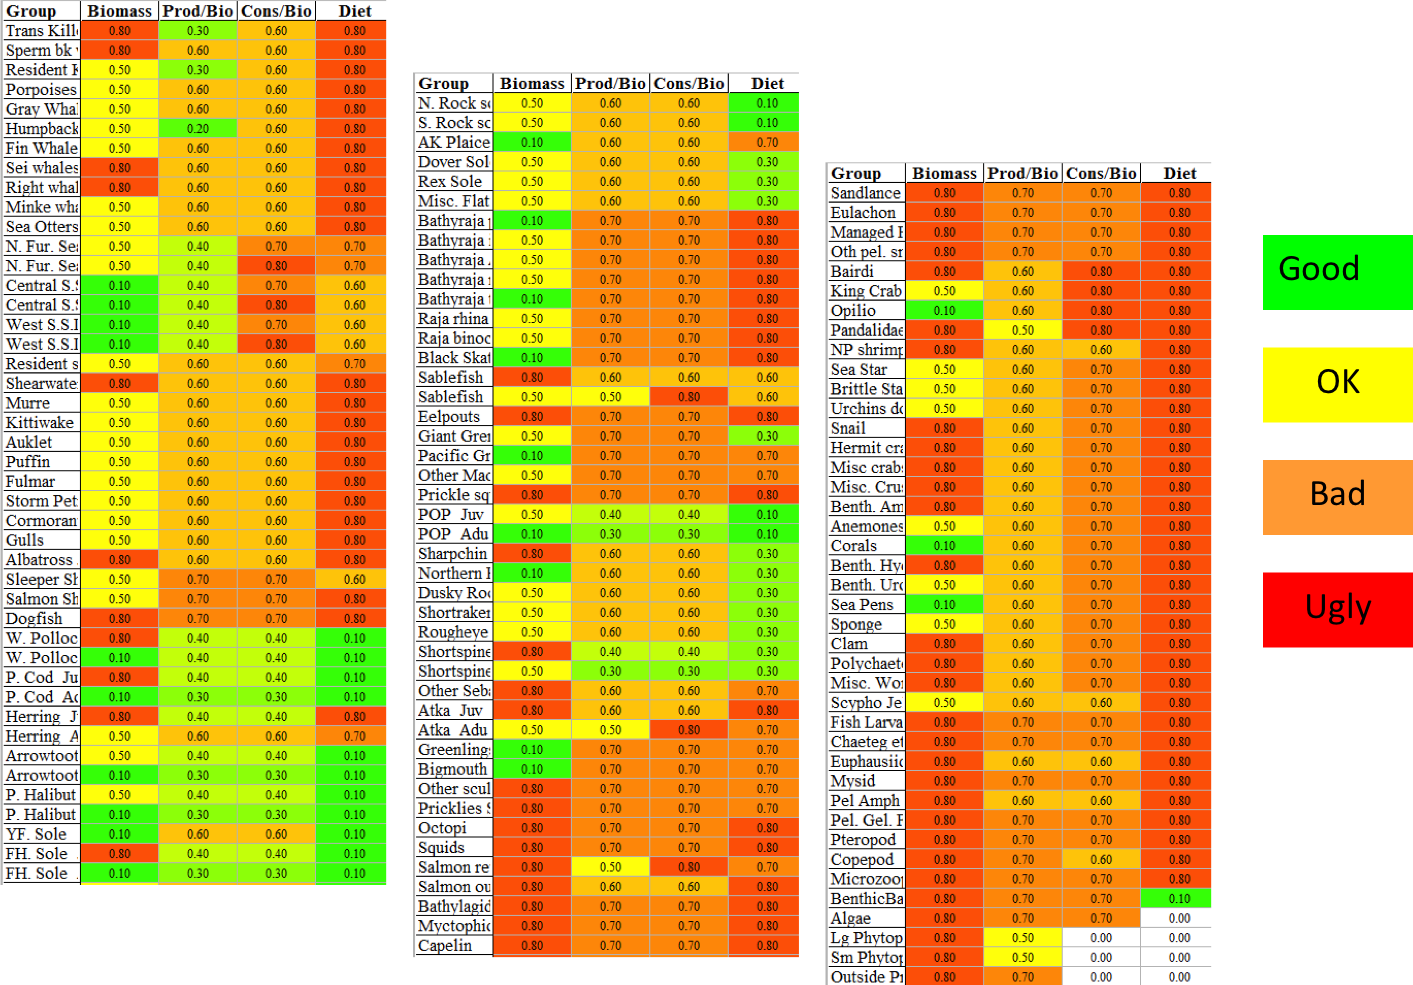 --- ## Ecosystem models and uncertainty: run a scenario  --- ## Ecosystem models and uncertainty: run a scenario  --- ## Ecosystem models and uncertainty: run a scenario  --- ## Ecosystem models and uncertainty: run a scenario in an ensemble  --- ## Ecosystem models and uncertainty: run a scenario in an ensemble  --- ## Ecosystem models and uncertainty: run a scenario in an ensemble  --- ## Ecosystem models and uncertainty: run a scenario in an ensemble  --- ## Defining ecosystem structure in the EBS and GOA: expectations Ecosystem reaction to pollock if pollock is a "wasp waist":  -- Pollock reaction to other groups if control is bottom up or top down:  --- ## Perturbation results: ecosystem reaction to 10% pollock increase <img src="EDAB_images/Fig6.png" width="100%" style="display: block; margin: auto;" /> --- ## Perturbation results: pollock reaction to 10% increase in others <img src="EDAB_images/Fig7.png" width="100%" style="display: block; margin: auto;" /> --- ## Perturbation results: ecosystem reaction to 10% phytoplankton increase <img src="EDAB_images/Fig8.png" width="100%" style="display: block; margin: auto;" /> --- ## Insights for fishery management - Differences in food web structure between two adjacent ecosystems with similar biological communities and fishery management - Which species respond to the same perturbation - Level of uncertainty / predictability in response - EBS: Influential group at mid trophic levels - Wasp waist transmits signal to other groups (neither AK system) - Self regulating dominant group (beer belly) absorbs signals - Beer belly systems are more predictable, stable as long as the beer belly maintains itself? - GOA: Influential groups at high trophic levels - Magnifies bottom up signals and top down? - A less predictable system? - Subject to more radical change? - Structure of a food web may determine how predictable a system is under perturbation, and how changes in primary production propagate through systems --- ## Appendix 2: Fishery management in the US Eight regional Fishery Management Councils establish plans for sustainable management of stocks within their jurisdictions. All are governed by the same law, but tailor management to their regional stakeholder needs. 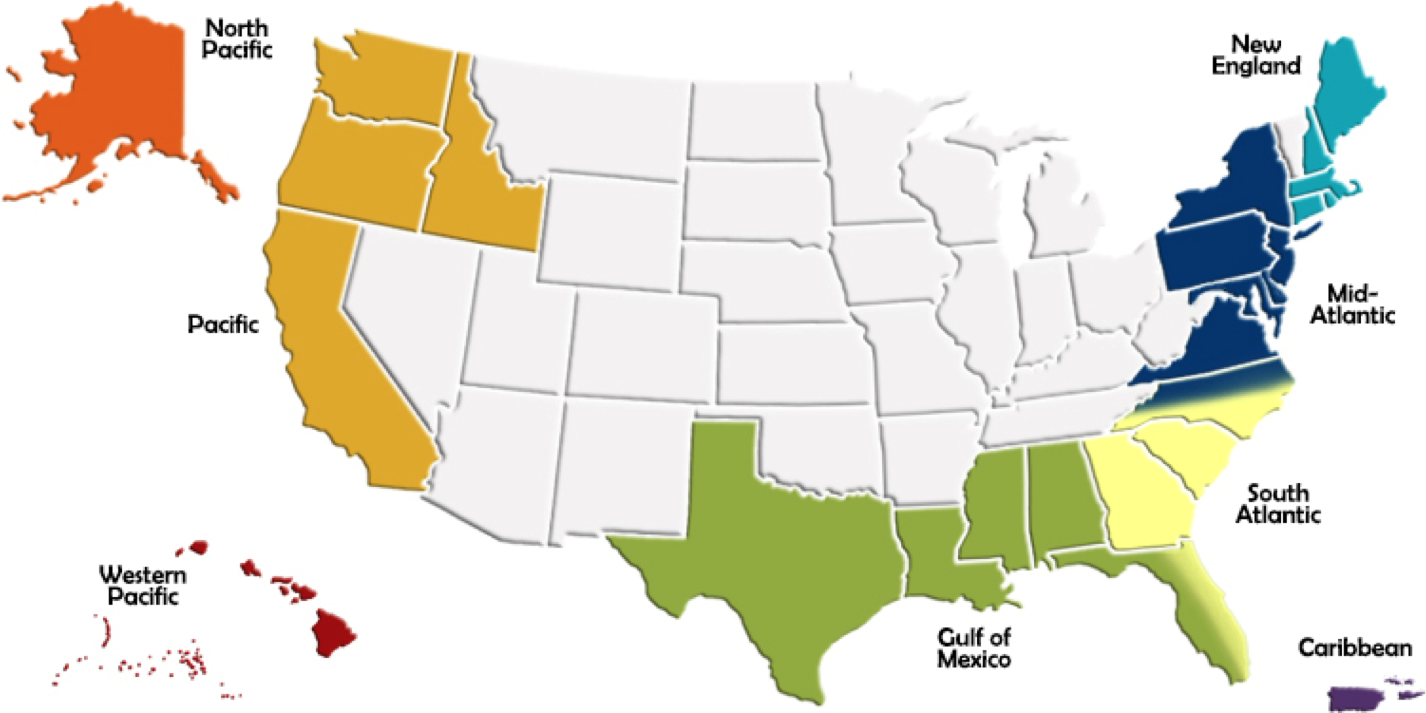 More information: http://www.fisherycouncils.org/ https://www.fisheries.noaa.gov/topic/laws-policies#magnuson-stevens-act