class: right, middle, my-title, title-slide # State of the Ecosystem: ## New England 2020 ### Sarah Gaichas and Kim Bastille <br /> Ecosystem Dynamics and Assessment <br /> Northeast Fisheries Science Center --- class: top, left # Today's Talk .pull-left[ - Review of Ecosystem reporting for NEFMC - New! Response memo - 2020 New England Report - SSC discussion and feedback ] .pull-right[ *The IEA Loop<sup>1</sup>* 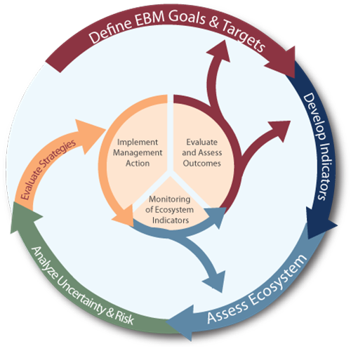 ] .footnote[ [1] https://www.integratedecosystemassessment.noaa.gov/national/IEA-approach ] ??? --- ## State of the Ecosystem (SOE) Reporting: Context for busy people *"So what?" --John Boreman, September 2016* 1. Clear linkage of ecosystem indicators with management objectives 1. Synthesis across indicators for big picture 1. Objectives related to human-well being placed first in report 1. Short (< 30 pages), non-technical (but rigorous) text 1. Emphasis on reproducibility .center[  ] ??? In 2016, we began taking steps to address these common critiques of the ESR model --- ## State of the Ecosystem 2020: Response Memo Our response to the need for more formal response to comments! * 30 comments or requests from 2019 * One addressed by having the response memo * 21 addressed within the SOE at SSC/Council request * New summary section with synthetic overview addresses 3 requests * 5 new indicators added * 3 existing indicators modified * 5 editorial updates * 5 partially addressed requests * 8 not currently addressed within SOE * 2 have information summaries in the response memo * 2 may be addressed by student projects * 1 needs feedback on how to deal with known data issue * 1 seeking data * 1 relevant to 2019 visualization that was replaced in 2020 * 1 beyond capacity to address at present SSC feedback requested on the approach and all details, memo has specific questions --- ## State of the Ecosystem 2020: Structure .pull-left[ ### Report Structure 1. Summary 2 pager 1. Human dimensions 1. Protected species 1. Fish and invertebrates (managed and otherwise) 1. Habitat quality and ecosystem productivity ] .pull-right[ *Established ecosystem-scale objectives in New England* <table class="risktable table" style="font-size: 14px; margin-left: auto; margin-right: auto;"> <thead> <tr> <th style="text-align:left;font-weight: bold;"> Objective Categories </th> <th style="text-align:left;font-weight: bold;"> Indicators reported here </th> </tr> </thead> <tbody> <tr> <td style="text-align:left;"> Seafood Production </td> <td style="text-align:left;"> Landings by feeding guild </td> </tr> <tr> <td style="text-align:left;"> Profits </td> <td style="text-align:left;"> Revenue decomposed to price and volume </td> </tr> <tr> <td style="text-align:left;"> Recreation </td> <td style="text-align:left;"> Days fished; recreational catch </td> </tr> <tr> <td style="text-align:left;"> Stability </td> <td style="text-align:left;"> Diversity indices (fishery and species) </td> </tr> <tr> <td style="text-align:left;"> Social & Cultural </td> <td style="text-align:left;"> Commercial engagement trends </td> </tr> <tr> <td style="text-align:left;"> Biomass </td> <td style="text-align:left;"> Biomass or abundance by feeding guild from surveys </td> </tr> <tr> <td style="text-align:left;"> Productivity </td> <td style="text-align:left;"> Condition and recruitment of managed species, Primary productivity </td> </tr> <tr> <td style="text-align:left;"> Trophic structure </td> <td style="text-align:left;"> Relative biomass of feeding guilds, Zooplankton </td> </tr> <tr> <td style="text-align:left;"> Habitat </td> <td style="text-align:left;"> Estuarine and offshore habitat conditions </td> </tr> </tbody> </table> ] --- ## Memo 1-2: Summary 2 pager with visualizations .pull-left[ 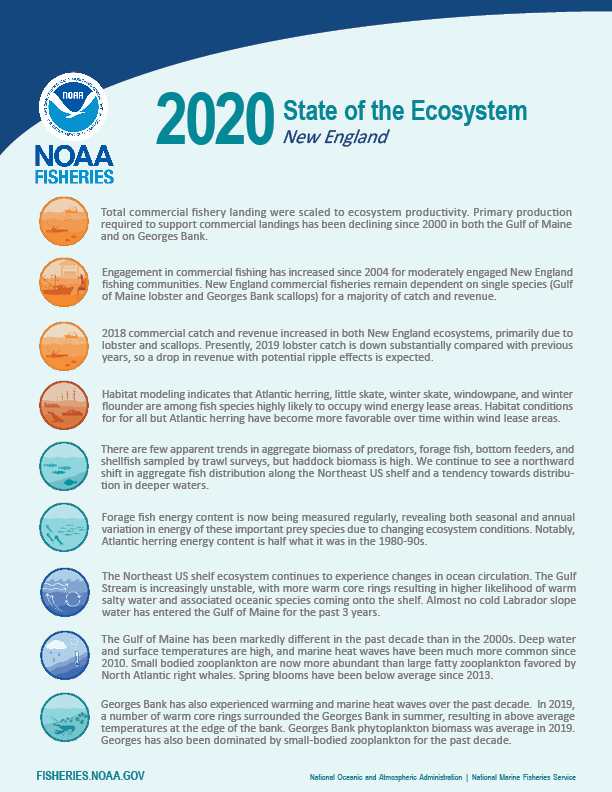 ] .pull-right[ 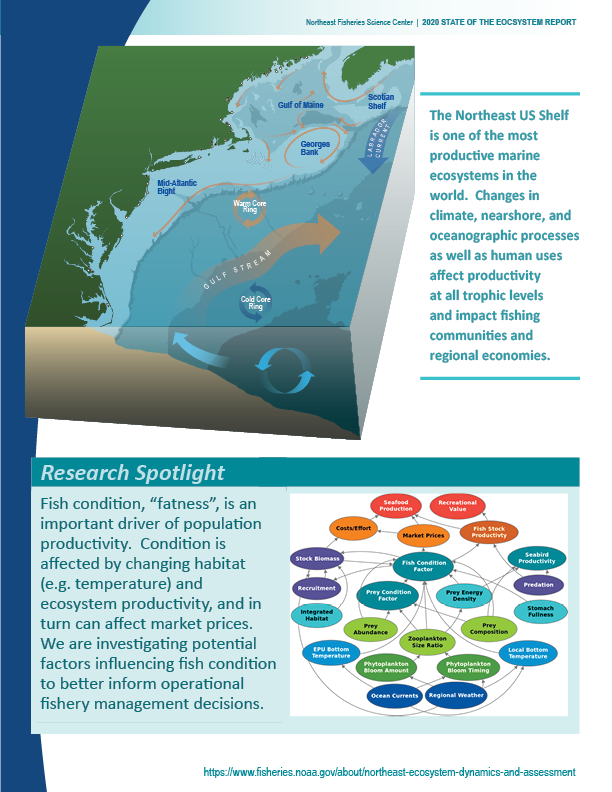 ] --- ## Memo 3: Indicator uncertainty  --- ## Memo 3: Indicator uncertainty questions: try model based (VAST)?  --- ## Memo 3: Indicator uncertainty questions: VAST? plus .pull-left[  ] .pull-right[ Uncertainty already included in: * Right whale abundance Uncertainty difficult to include in: * Landings * Some diversity indices * Condition and productivity plots ] ## Priorities for uncertainty in other indicators? ## Recommended methods? --- ## Memo 4: Downeast ME (EPU-survey strata update) .center[  ] --- ## Memo 5: Link zooplankton, fish condition .pull-left[ 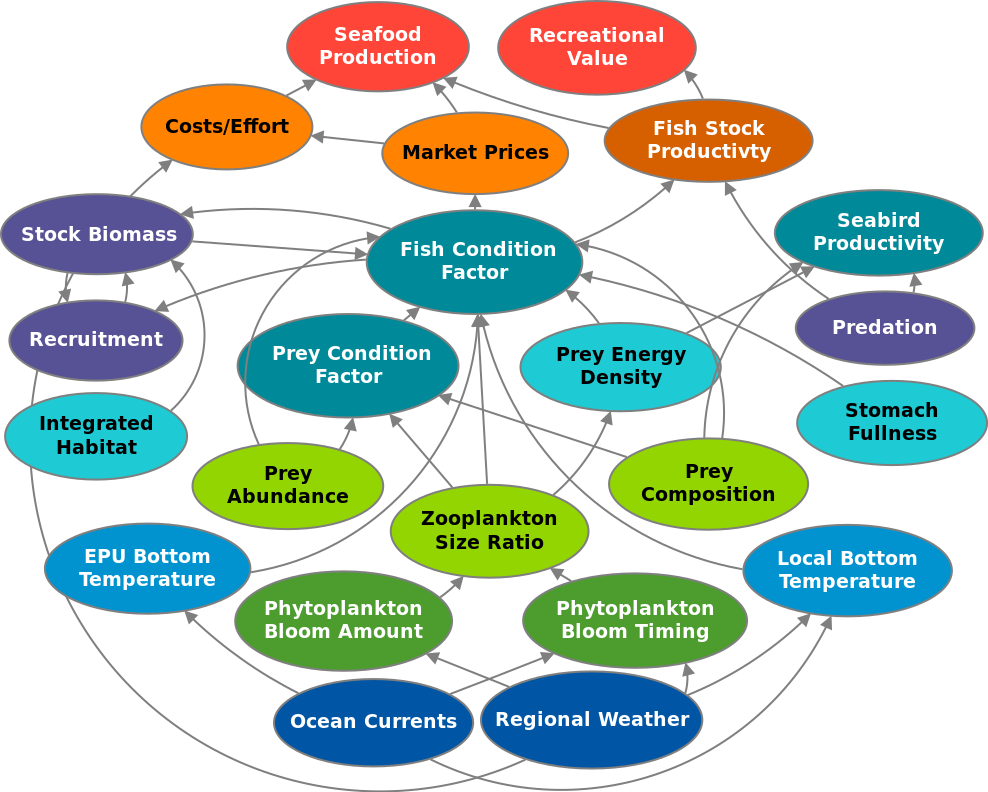 ] .pull-right[ 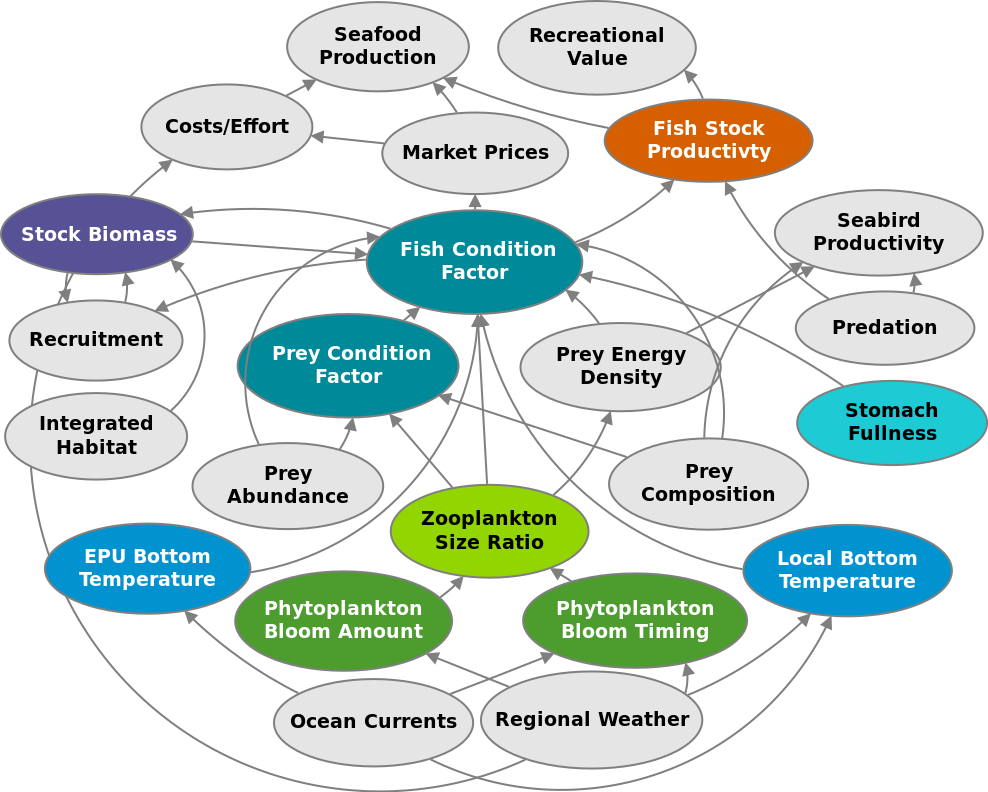 ] Conceptual model links indicators in the report with management objectives. A subset of objectives are currently under investigation using GAMs. We plan to extend this work with structural equation modeling and or other methods in 2020. --- ## Memo 6: Ocean Acidification NOAA is finalizing an Ocean Acidification research plan<sup>1</sup>. Work is in progress to to bolster monitoring and to develop a baseline climatology for our region. .center[ 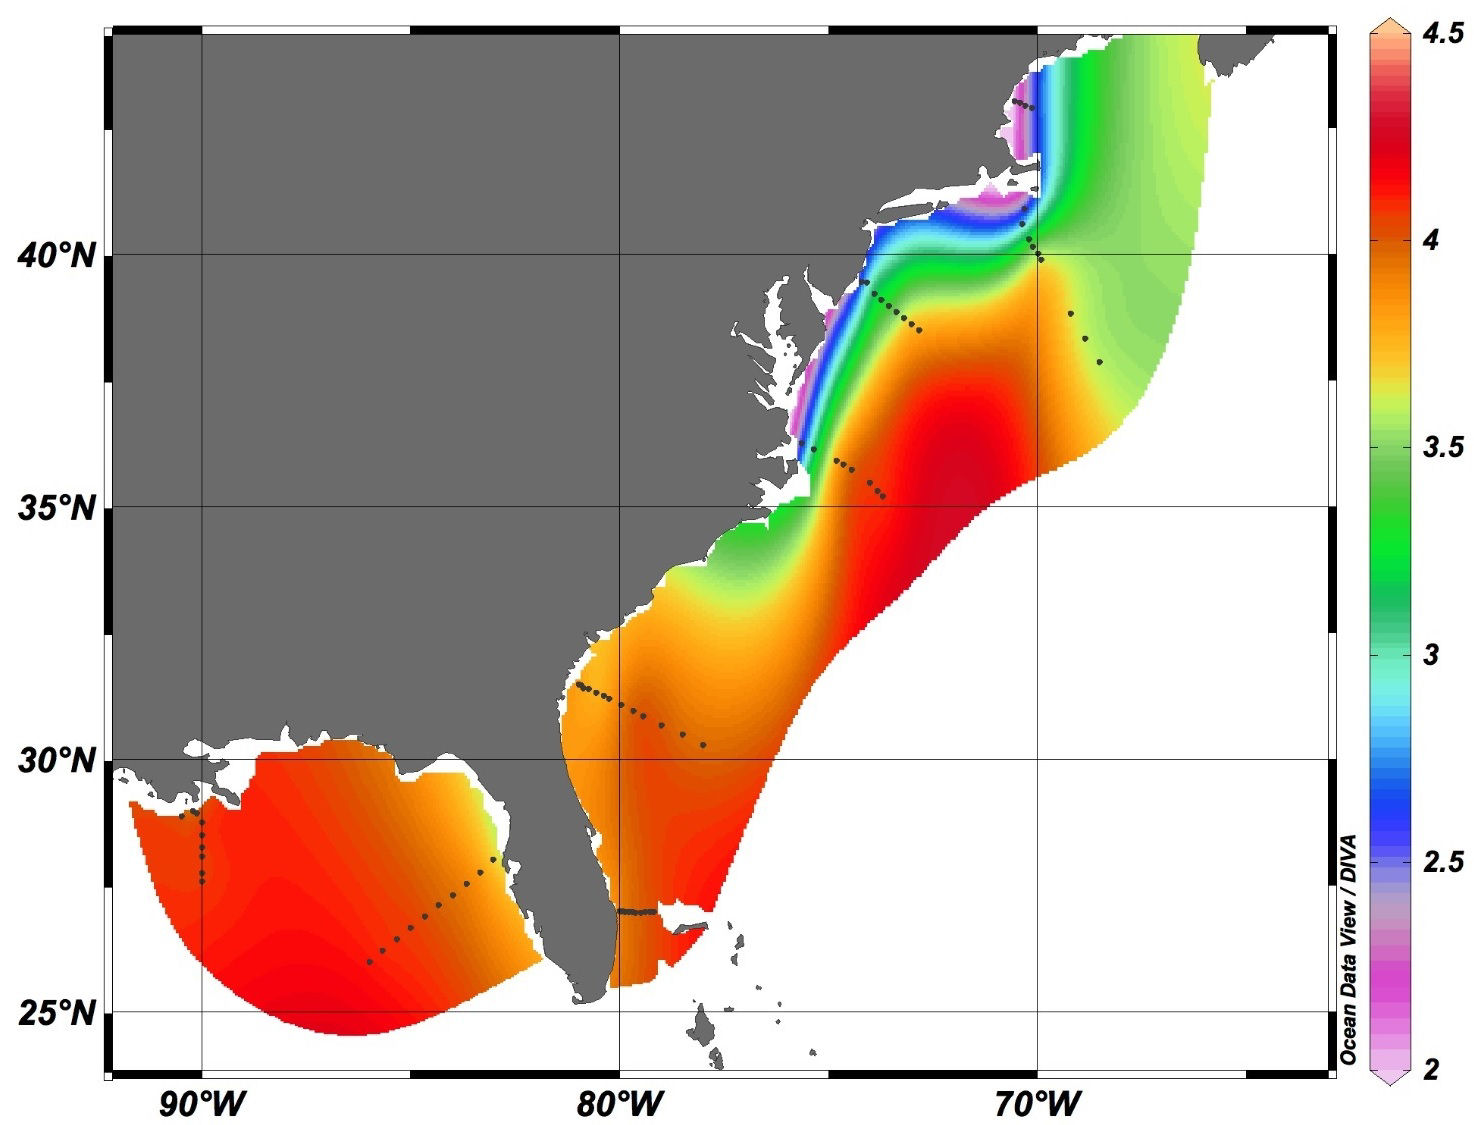 ] A time series indicator may be several years away. Until then, we seek feedback on what available information (for example, initial monitoring<sup>2</sup>) would be useful to the Councils right now. .footnote[ [1] https://sab.noaa.gov/sites/SAB/Meetings/2019_Documents/Dec_Meeting/2020%20OA%20Research%20Plan%20DRAFT%20External%20Review.pdf [2] https://www.aoml.noaa.gov/ocd/ocdweb/occ_oa.html ] --- ## Memo 7: Gulf Stream and Labrador Current .pull-left-40[ 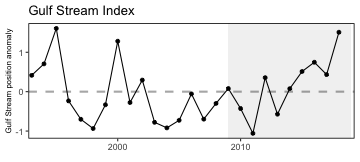 ] .pull-right-60[  ] ## Memo 11: Warm Core Rings .center[  ] ??? MAFMC requested that this indicator be included (in past years it was in the New England report only). --- .pull-left-30[ ## Memo 8: PP Source Satellite for all indicators ] .pull-right-70[ .center[  ] ] ## Memo 9: Shellfish Growth Roger Mann (VIMS) looking to fund student at NEFSC to evaluate ## Memo 10: Power Plants Unable to address this aspect of estuarine water quality this year, but see 13 --- .pull-left[ ## Memo 12: Cold Pool Index  Temperature change within the cold pool vs. volume or other metric? ] .pull-right[ 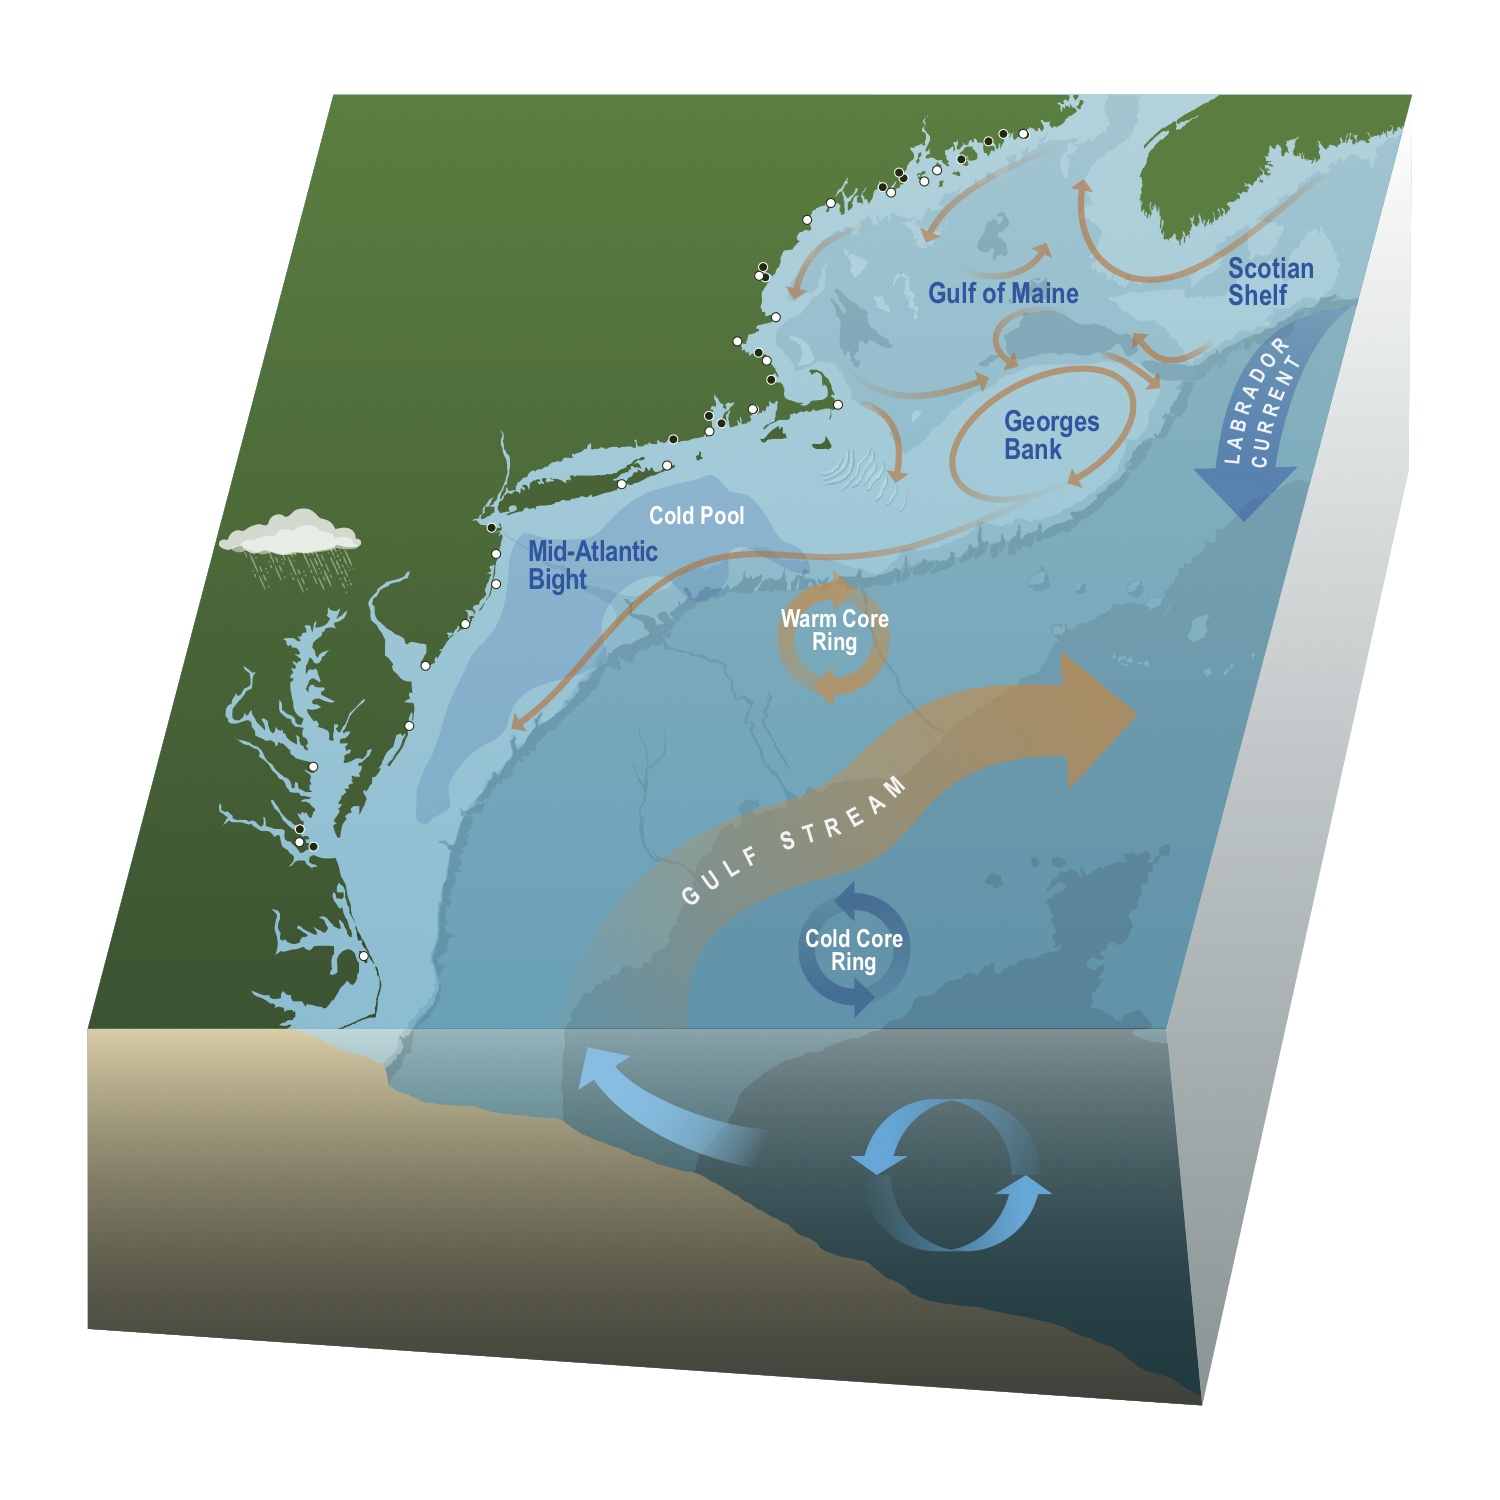 ] --- ## Memo 13: Estuarine Water Quality .pull-left[ *Chesapeake Bay water quality update* 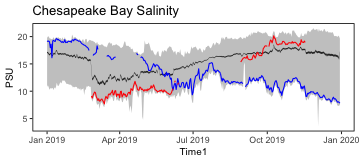 High precipitation let to extreme low salinity event in spring 2019 <br /> ## What spatial scale to combine NERR data? ## What indicators of most interest? ## Use existing thresholds? ] .pull-right[ *How best to incorporate NERR data?* 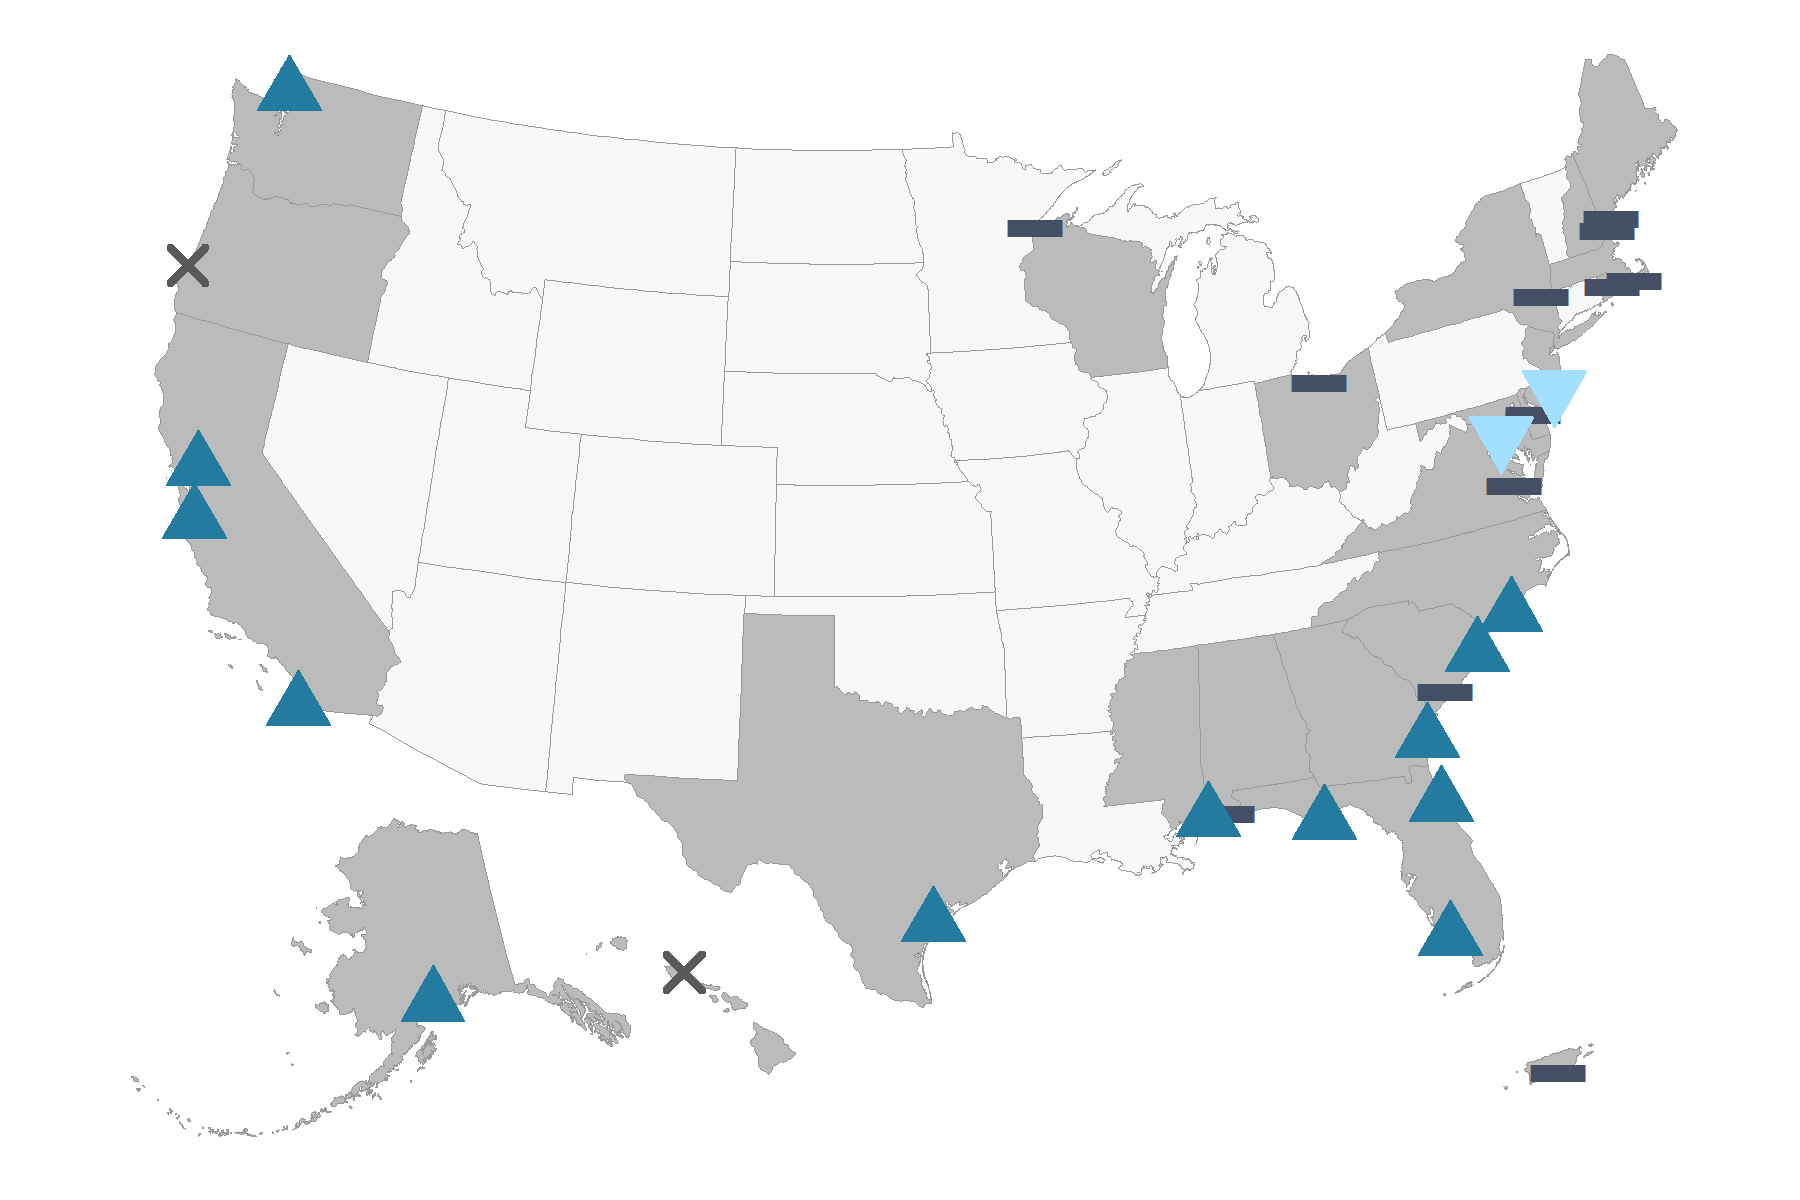 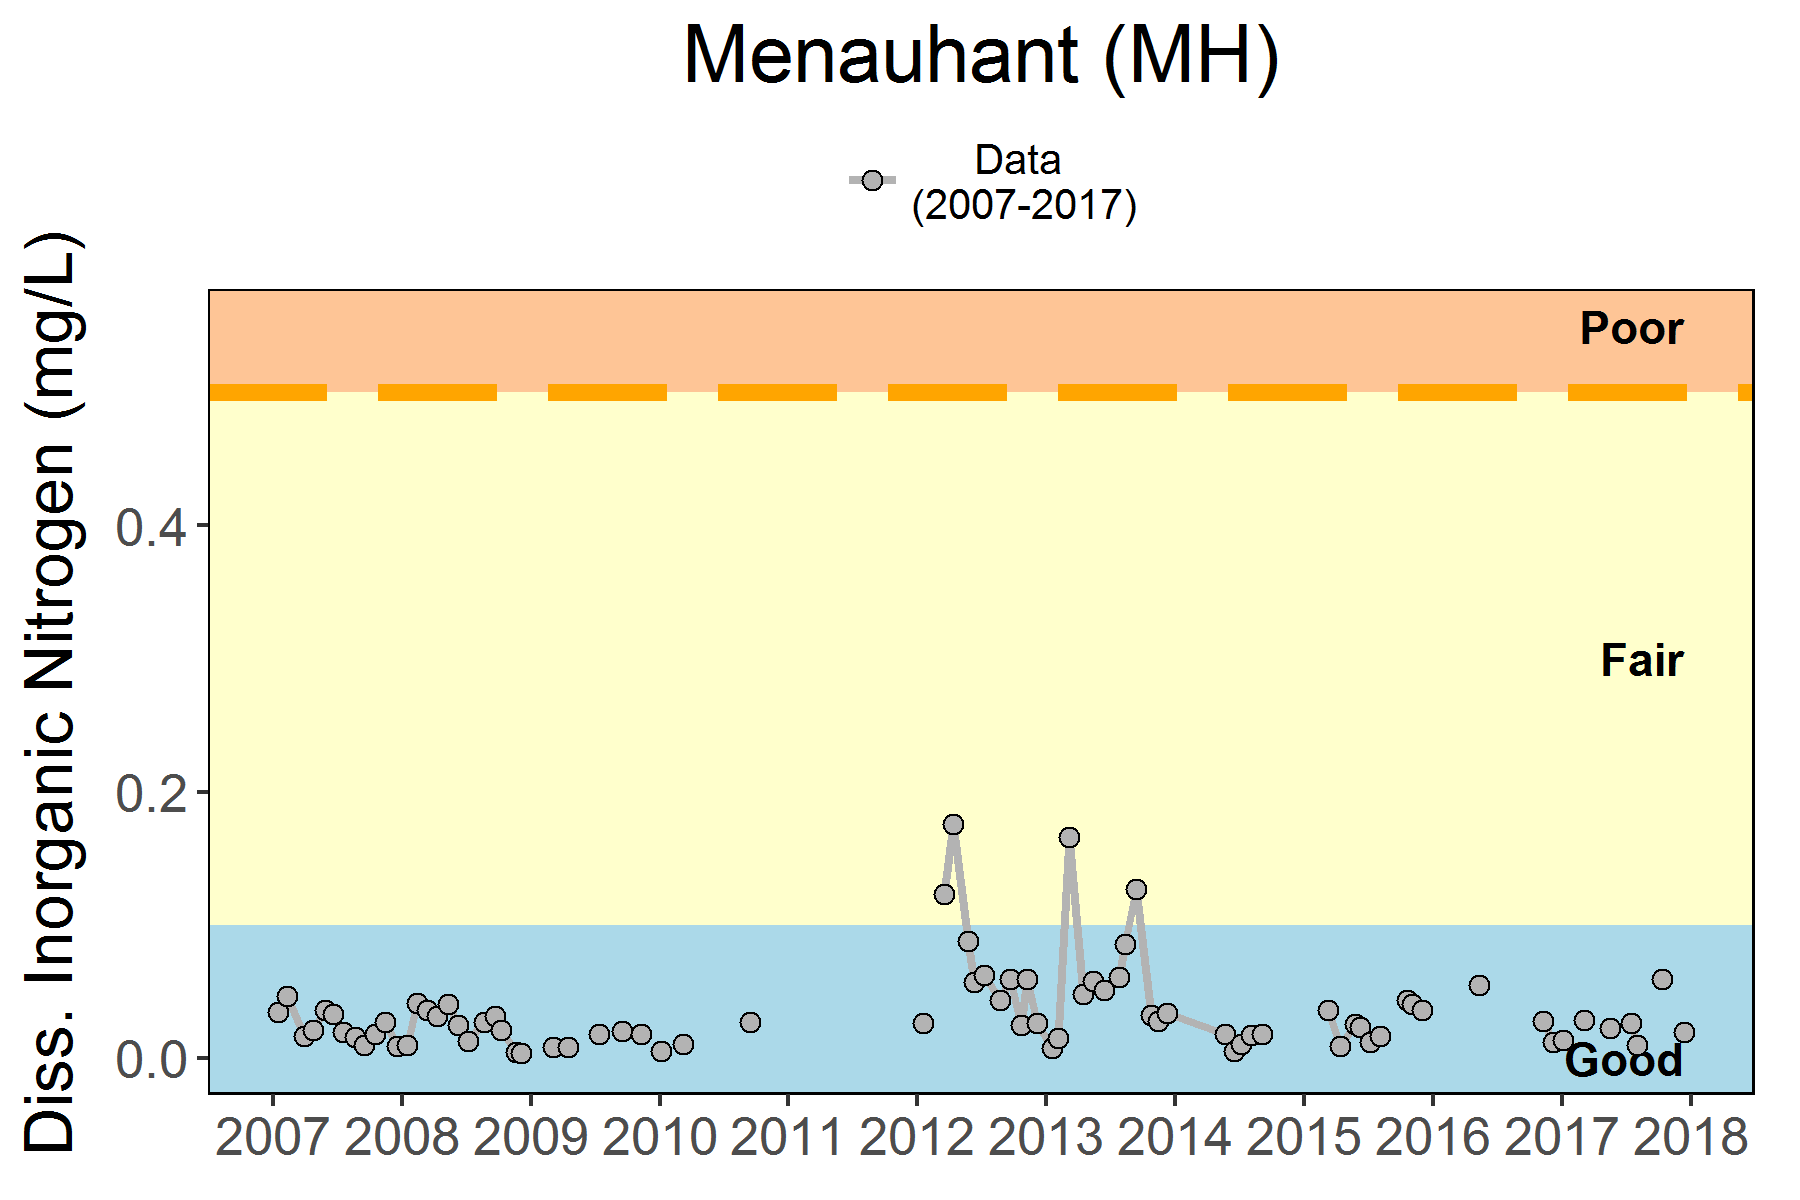 ] --- ## Memo 14: Link Environment and Society *Primary Production Required to support landings (see also Memo 5, Memo 15)* .pull-left[  ## Transfer efficiency 15% ## Unlagged landings and primary production ## Landings threshold 80% ## Which sensitivities to explore? ] .pull-right[ *Georges Bank species comprising 80% of landings*  ] --- ## New Indicator: Fishery links to society .center[  ] Increase in highly engaged New England communities; changing score driven by scallop and lobster value?  --- ## Memo 15: Wind Energy Habitat Overlap <table class="risktable table" style="font-size: 11px; margin-left: auto; margin-right: auto;"> <thead> <tr> <th style="border-bottom:hidden" colspan="1"></th> <th style="border-bottom:hidden; padding-bottom:0; padding-left:3px;padding-right:3px;text-align: center; " colspan="2"><div style="border-bottom: 1px solid #ddd; padding-bottom: 5px; ">Existing - North</div></th> <th style="border-bottom:hidden; padding-bottom:0; padding-left:3px;padding-right:3px;text-align: center; " colspan="2"><div style="border-bottom: 1px solid #ddd; padding-bottom: 5px; ">Proposed - North</div></th> <th style="border-bottom:hidden; padding-bottom:0; padding-left:3px;padding-right:3px;text-align: center; " colspan="2"><div style="border-bottom: 1px solid #ddd; padding-bottom: 5px; ">Existing - Mid</div></th> <th style="border-bottom:hidden; padding-bottom:0; padding-left:3px;padding-right:3px;text-align: center; " colspan="2"><div style="border-bottom: 1px solid #ddd; padding-bottom: 5px; ">Proposed - Mid</div></th> <th style="border-bottom:hidden; padding-bottom:0; padding-left:3px;padding-right:3px;text-align: center; " colspan="2"><div style="border-bottom: 1px solid #ddd; padding-bottom: 5px; ">Existing - South</div></th> </tr> <tr> <th style="text-align:left;font-weight: bold;"> Season </th> <th style="text-align:left;font-weight: bold;"> Species </th> <th style="text-align:left;font-weight: bold;"> Trend </th> <th style="text-align:left;font-weight: bold;"> Species </th> <th style="text-align:left;font-weight: bold;"> Trend </th> <th style="text-align:left;font-weight: bold;"> Species </th> <th style="text-align:left;font-weight: bold;"> Trend </th> <th style="text-align:left;font-weight: bold;"> Species </th> <th style="text-align:left;font-weight: bold;"> Trend </th> <th style="text-align:left;font-weight: bold;"> Species </th> <th style="text-align:left;font-weight: bold;"> Trend </th> </tr> </thead> <tbody> <tr> <td style="text-align:left;"> Spring </td> <td style="text-align:left;"> Little Skate </td> <td style="text-align:left;"> `\(\nearrow\)` </td> <td style="text-align:left;"> Atlantic Herring </td> <td style="text-align:left;"> </td> <td style="text-align:left;"> Little Skate </td> <td style="text-align:left;"> `\(\nearrow\)` </td> <td style="text-align:left;"> Spiny Dogfish </td> <td style="text-align:left;"> `\(\nearrow\)` </td> <td style="text-align:left;"> Spiny Dogfish </td> <td style="text-align:left;"> `\(\nearrow\)` </td> </tr> <tr> <td style="text-align:left;"> Spring </td> <td style="text-align:left;"> Atlantic Herring </td> <td style="text-align:left;"> `\(\searrow\)` </td> <td style="text-align:left;"> Little Skate </td> <td style="text-align:left;"> `\(\nearrow\)` </td> <td style="text-align:left;"> Atlantic Herring </td> <td style="text-align:left;"> `\(\searrow\)` </td> <td style="text-align:left;"> Atlantic Herring </td> <td style="text-align:left;"> `\(\searrow\)` </td> <td style="text-align:left;"> Longfin Squid </td> <td style="text-align:left;"> `\(\nearrow\)` </td> </tr> <tr> <td style="text-align:left;"> Spring </td> <td style="text-align:left;"> Windowpane </td> <td style="text-align:left;"> `\(\nearrow\)` </td> <td style="text-align:left;"> Longhorn Sculpin </td> <td style="text-align:left;"> `\(\nearrow\)` </td> <td style="text-align:left;"> Spiny Dogfish </td> <td style="text-align:left;"> `\(\nearrow\)` </td> <td style="text-align:left;"> Little Skate </td> <td style="text-align:left;"> `\(\nearrow\)` </td> <td style="text-align:left;"> Summer Flounder </td> <td style="text-align:left;"> `\(\nearrow\)` </td> </tr> <tr> <td style="text-align:left;"> Spring </td> <td style="text-align:left;"> Winter Skate </td> <td style="text-align:left;"> `\(\nearrow\)` </td> <td style="text-align:left;"> Windowpane </td> <td style="text-align:left;"> `\(\nearrow\)` </td> <td style="text-align:left;"> Windowpane </td> <td style="text-align:left;"> `\(\nearrow\)` </td> <td style="text-align:left;"> Alewife </td> <td style="text-align:left;"> `\(\searrow\)` </td> <td style="text-align:left;"> Clearnose Skate </td> <td style="text-align:left;"> `\(\nearrow\)` </td> </tr> <tr> <td style="text-align:left;"> Spring </td> <td style="text-align:left;"> Longhorn Sculpin </td> <td style="text-align:left;"> `\(\nearrow\)` </td> <td style="text-align:left;"> Alewife </td> <td style="text-align:left;"> `\(\searrow\)` </td> <td style="text-align:left;"> Winter Skate </td> <td style="text-align:left;"> `\(\nearrow\)` </td> <td style="text-align:left;"> Silver Hake </td> <td style="text-align:left;"> `\(\nearrow\)` </td> <td style="text-align:left;"> Spotted Hake </td> <td style="text-align:left;"> `\(\nearrow\)` </td> </tr> <tr> <td style="text-align:left;"> Fall </td> <td style="text-align:left;"> Butterfish </td> <td style="text-align:left;"> `\(\nearrow\)` </td> <td style="text-align:left;"> Butterfish </td> <td style="text-align:left;"> `\(\nearrow\)` </td> <td style="text-align:left;"> Summer Flounder </td> <td style="text-align:left;"> `\(\nearrow\)` </td> <td style="text-align:left;"> Longhorn Sculpin </td> <td style="text-align:left;"> `\(\nearrow\)` </td> <td style="text-align:left;"> Longfin Squid </td> <td style="text-align:left;"> `\(\searrow\)` </td> </tr> <tr> <td style="text-align:left;"> Fall </td> <td style="text-align:left;"> Longfin Squid </td> <td style="text-align:left;"> `\(\nearrow\)` </td> <td style="text-align:left;"> Fourspot Flounder </td> <td style="text-align:left;"> </td> <td style="text-align:left;"> Longfin Squid </td> <td style="text-align:left;"> `\(\nearrow\)` </td> <td style="text-align:left;"> Little Skate </td> <td style="text-align:left;"> `\(\nearrow\)` </td> <td style="text-align:left;"> Northern Searobin </td> <td style="text-align:left;"> `\(\nearrow\)` </td> </tr> <tr> <td style="text-align:left;"> Fall </td> <td style="text-align:left;"> Summer Flounder </td> <td style="text-align:left;"> `\(\nearrow\)` </td> <td style="text-align:left;"> Longhorn Sculpin </td> <td style="text-align:left;"> `\(\searrow\)` </td> <td style="text-align:left;"> Butterfish </td> <td style="text-align:left;"> `\(\nearrow\)` </td> <td style="text-align:left;"> Butterfish </td> <td style="text-align:left;"> `\(\nearrow\)` </td> <td style="text-align:left;"> Clearnose Skate </td> <td style="text-align:left;"> `\(\nearrow\)` </td> </tr> <tr> <td style="text-align:left;"> Fall </td> <td style="text-align:left;"> Winter Flounder </td> <td style="text-align:left;"> `\(\searrow\)` </td> <td style="text-align:left;"> Summer Flounder </td> <td style="text-align:left;"> `\(\nearrow\)` </td> <td style="text-align:left;"> Smooth Dogfish </td> <td style="text-align:left;"> `\(\nearrow\)` </td> <td style="text-align:left;"> Sea Scallop </td> <td style="text-align:left;"> `\(\nearrow\)` </td> <td style="text-align:left;"> Butterfish </td> <td style="text-align:left;"> `\(\nearrow\)` </td> </tr> <tr> <td style="text-align:left;"> Fall </td> <td style="text-align:left;"> Spiny Dogfish </td> <td style="text-align:left;"> `\(\searrow\)` </td> <td style="text-align:left;"> Spiny Dogfish </td> <td style="text-align:left;"> `\(\searrow\)` </td> <td style="text-align:left;"> Windowpane </td> <td style="text-align:left;"> `\(\nearrow\)` </td> <td style="text-align:left;"> Fourspot Flounder </td> <td style="text-align:left;"> `\(\nearrow\)` </td> <td style="text-align:left;"> Spiny Dogfish/Spotted Hake </td> <td style="text-align:left;"> `\(\nearrow\)` </td> </tr> </tbody> </table> .pull-left[  ] .pull-right[ ## Fishery overlap to be added ## What habitat model outputs most useful? ] --- ## Memo 16: Other Social Science Indicators Included https://www.st.nmfs.noaa.gov/humandimensions/social-indicators/ ## Memo 17: Management Complexity Define how to use indicator to refine further ## Memo 18: SAFMC and ASMFC Species .pull-left[ Unchanged NE rec. catch diversity trend  ] .pull-right[  ] ## Memo 19: Conceptual Model Social Elements Not added because the previous conceptual model was replaced --- ## Memo 20: Fish Diet Indicators  Define objectives for this indicator for further refinement. --- ## Memo 21: Right Whale Calves .center[ 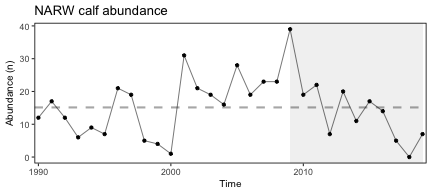 ] ## Memo 22: Distinguish Managed Species Council-managed species separated in landings plots; see Appendix table. ## Memo 23: Marine Mammal Consumption Seal diet information added, but inadequate information to estimate consumption. --- ## Memo 24: Small Pelagic Abundance  Attempt VAST? Other data sources and suggestions? *Forage energy density:* <table class="table" style="font-size: 11px; margin-left: auto; margin-right: auto;"> <thead> <tr> <th style="border-bottom:hidden" colspan="1"></th> <th style="border-bottom:hidden; padding-bottom:0; padding-left:3px;padding-right:3px;text-align: center; " colspan="2"><div style="border-bottom: 1px solid #ddd; padding-bottom: 5px; ">Spring 2017</div></th> <th style="border-bottom:hidden; padding-bottom:0; padding-left:3px;padding-right:3px;text-align: center; " colspan="2"><div style="border-bottom: 1px solid #ddd; padding-bottom: 5px; ">Fall 2017</div></th> <th style="border-bottom:hidden; padding-bottom:0; padding-left:3px;padding-right:3px;text-align: center; " colspan="2"><div style="border-bottom: 1px solid #ddd; padding-bottom: 5px; ">Spring 2018</div></th> <th style="border-bottom:hidden; padding-bottom:0; padding-left:3px;padding-right:3px;text-align: center; " colspan="2"><div style="border-bottom: 1px solid #ddd; padding-bottom: 5px; ">Fall 2018</div></th> <th style="border-bottom:hidden; padding-bottom:0; padding-left:3px;padding-right:3px;text-align: center; " colspan="2"><div style="border-bottom: 1px solid #ddd; padding-bottom: 5px; ">Total</div></th> <th style="border-bottom:hidden; padding-bottom:0; padding-left:3px;padding-right:3px;text-align: center; " colspan="1"><div style="border-bottom: 1px solid #ddd; padding-bottom: 5px; ">1980s</div></th> <th style="border-bottom:hidden; padding-bottom:0; padding-left:3px;padding-right:3px;text-align: center; " colspan="1"><div style="border-bottom: 1px solid #ddd; padding-bottom: 5px; ">1990s</div></th> </tr> <tr> <th style="text-align:left;font-weight: bold;"> Species </th> <th style="text-align:left;font-weight: bold;"> ED (SD) </th> <th style="text-align:right;font-weight: bold;"> N </th> <th style="text-align:left;font-weight: bold;"> ED (SD) </th> <th style="text-align:right;font-weight: bold;"> N </th> <th style="text-align:left;font-weight: bold;"> ED (SD) </th> <th style="text-align:right;font-weight: bold;"> N </th> <th style="text-align:left;font-weight: bold;"> ED (SD) </th> <th style="text-align:right;font-weight: bold;"> N </th> <th style="text-align:left;font-weight: bold;"> ED (SD) </th> <th style="text-align:right;font-weight: bold;"> N </th> <th style="text-align:right;font-weight: bold;"> ED </th> <th style="text-align:left;font-weight: bold;"> ED (SD) </th> </tr> </thead> <tbody> <tr> <td style="text-align:left;"> Alewife </td> <td style="text-align:left;"> 6.84 (1.62) </td> <td style="text-align:right;"> 128 </td> <td style="text-align:left;"> 8.12 (1.46) </td> <td style="text-align:right;"> 50 </td> <td style="text-align:left;"> 6.45 (1.21) </td> <td style="text-align:right;"> 47 </td> <td style="text-align:left;"> 7.41 (1.6) </td> <td style="text-align:right;"> 42 </td> <td style="text-align:left;"> 7.1 (1.62) </td> <td style="text-align:right;"> 267 </td> <td style="text-align:right;"> 6.4 </td> <td style="text-align:left;"> </td> </tr> <tr> <td style="text-align:left;"> Atl. Herring </td> <td style="text-align:left;"> 5.34 (0.94) </td> <td style="text-align:right;"> 122 </td> <td style="text-align:left;"> 5.77 (1.31) </td> <td style="text-align:right;"> 52 </td> <td style="text-align:left;"> 6.69 (0.85) </td> <td style="text-align:right;"> 51 </td> <td style="text-align:left;"> 5.41 (1.34) </td> <td style="text-align:right;"> 50 </td> <td style="text-align:left;"> 5.69 (1.19) </td> <td style="text-align:right;"> 275 </td> <td style="text-align:right;"> 10.6 </td> <td style="text-align:left;"> 9.4 (1.4) </td> </tr> <tr> <td style="text-align:left;"> Atl. Mackerel </td> <td style="text-align:left;"> </td> <td style="text-align:right;"> NA </td> <td style="text-align:left;"> 7.24 (1.13) </td> <td style="text-align:right;"> 50 </td> <td style="text-align:left;"> 5.33 (0.86) </td> <td style="text-align:right;"> 51 </td> <td style="text-align:left;"> 6.89 (1.07) </td> <td style="text-align:right;"> 50 </td> <td style="text-align:left;"> 6.48 (1.32) </td> <td style="text-align:right;"> 151 </td> <td style="text-align:right;"> 6.0 </td> <td style="text-align:left;"> </td> </tr> <tr> <td style="text-align:left;"> Butterfish </td> <td style="text-align:left;"> 7.13 (1.59) </td> <td style="text-align:right;"> 65 </td> <td style="text-align:left;"> 7.31 (1.45) </td> <td style="text-align:right;"> 89 </td> <td style="text-align:left;"> 4.91 (1.12) </td> <td style="text-align:right;"> 53 </td> <td style="text-align:left;"> 8.1 (2.7) </td> <td style="text-align:right;"> 50 </td> <td style="text-align:left;"> 6.92 (2.04) </td> <td style="text-align:right;"> 257 </td> <td style="text-align:right;"> 6.2 </td> <td style="text-align:left;"> </td> </tr> <tr> <td style="text-align:left;"> Illex </td> <td style="text-align:left;"> 5.54 (0.4) </td> <td style="text-align:right;"> 77 </td> <td style="text-align:left;"> 5.43 (0.51) </td> <td style="text-align:right;"> 52 </td> <td style="text-align:left;"> 5.5 (0.52) </td> <td style="text-align:right;"> 50 </td> <td style="text-align:left;"> 4.76 (0.79) </td> <td style="text-align:right;"> 50 </td> <td style="text-align:left;"> 5.33 (0.63) </td> <td style="text-align:right;"> 229 </td> <td style="text-align:right;"> 7.1 </td> <td style="text-align:left;"> 5.9 (0.56) </td> </tr> <tr> <td style="text-align:left;"> Loligo </td> <td style="text-align:left;"> 5.22 (0.36) </td> <td style="text-align:right;"> 83 </td> <td style="text-align:left;"> 5.24 (0.26) </td> <td style="text-align:right;"> 60 </td> <td style="text-align:left;"> 4.84 (0.63) </td> <td style="text-align:right;"> 52 </td> <td style="text-align:left;"> 4.6 (0.72) </td> <td style="text-align:right;"> 50 </td> <td style="text-align:left;"> 5.02 (0.56) </td> <td style="text-align:right;"> 245 </td> <td style="text-align:right;"> 5.6 </td> <td style="text-align:left;"> </td> </tr> <tr> <td style="text-align:left;"> Sand lance </td> <td style="text-align:left;"> 6.66 (0.54) </td> <td style="text-align:right;"> 18 </td> <td style="text-align:left;"> </td> <td style="text-align:right;"> NA </td> <td style="text-align:left;"> 5.78 (0.34) </td> <td style="text-align:right;"> 60 </td> <td style="text-align:left;"> 7.99 (0.74) </td> <td style="text-align:right;"> 8 </td> <td style="text-align:left;"> 6.17 (0.81) </td> <td style="text-align:right;"> 86 </td> <td style="text-align:right;"> 6.8 </td> <td style="text-align:left;"> 4.4 (0.82) </td> </tr> <tr> <td style="text-align:left;"> Silver hake </td> <td style="text-align:left;"> 4.25 (0.39) </td> <td style="text-align:right;"> 189 </td> <td style="text-align:left;"> 4.42 (0.45) </td> <td style="text-align:right;"> 50 </td> <td style="text-align:left;"> 4.19 (0.39) </td> <td style="text-align:right;"> 50 </td> <td style="text-align:left;"> 4.55 (0.63) </td> <td style="text-align:right;"> 50 </td> <td style="text-align:left;"> 4.31 (0.46) </td> <td style="text-align:right;"> 339 </td> <td style="text-align:right;"> 4.6 </td> <td style="text-align:left;"> </td> </tr> </tbody> </table> --- ## Memo 25: Young of Year Index .pull-left-40[ 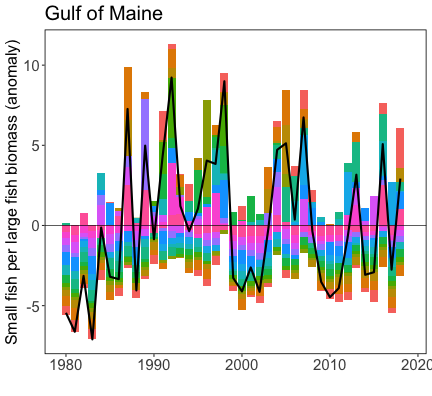<!-- --> ] .pull-right-60[ 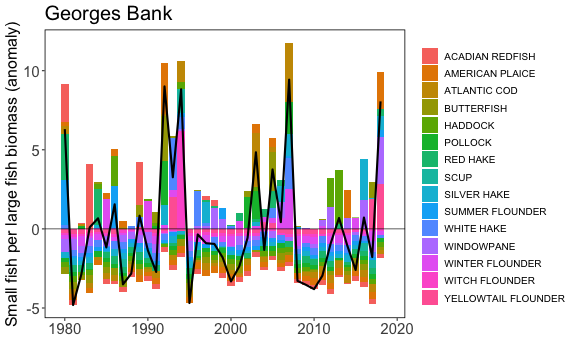<!-- --> ] ## Memo 26: Shark Biomass Still looking for a source; HMS provided 2017-2019 landings ## Memo 27: Trawl Species Diversity Inappropriate to combine Albatross and Bigelow--separate indices? --- ## Memo 28: Ecosystem Risk Score Options from the literature, or combine existing indicators? .center[ 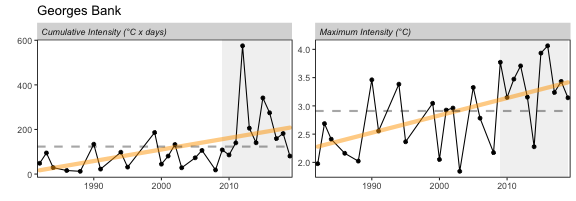 ] .pull-left[ 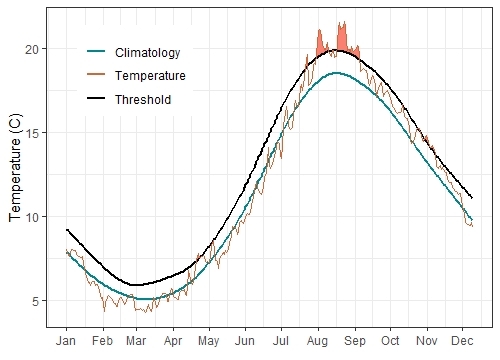 ] .pull-right[ 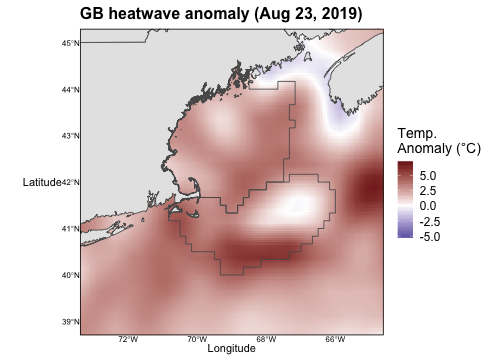 ] --- ## Memo 29: Thresholds and Inflection Points Individual indicators or using many indicators at once? Single indicator example: .center[ 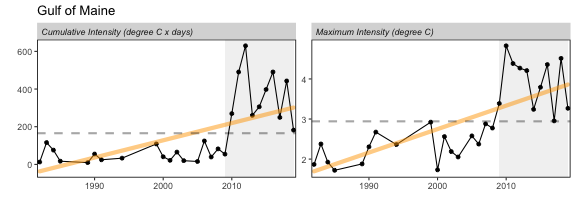 ] ## Lots of academic work on this: what is a useful starting point? .contrib[ Large, S. I., Fay, G., Friedland, K. D., and Link, J. S. 2013. Defining trends and thresholds in responses of ecological indicators to fishing and environmental pressures. ICES Journal of Marine Science, 70: 755–767. Large, S. I., Fay, G., Friedland, K. D., and Link, J. S. 2015. Quantifying Patterns of Change in Marine Ecosystem Response to Multiple Pressures: e0119922. PLoS One, 10. http://search.proquest.com/docview/1664222461/abstract/120C1207C54548BEPQ/1 (Accessed 14 October 2016). Samhouri, J. F., Andrews, K. S., Fay, G., Harvey, C. J., Hazen, E. L., Hennessey, S. M., Holsman, K., et al. 2017. Defining ecosystem thresholds for human activities and environmental pressures in the California Current. Ecosphere, 8: e01860. Tam, J. C., Link, J. S., Large, S. I., Andrews, K., Friedland, K. D., Gove, J., Hazen, E., et al. 2017. Comparing Apples to Oranges: Common Trends and Thresholds in Anthropogenic and Environmental Pressures across Multiple Marine Ecosystems. Frontiers in Marine Science, 4. Frontiers. https://www.frontiersin.org/articles/10.3389/fmars.2017.00282/full (Accessed 9 March 2020). ] --- ## SOE Take Home Messages * Primary production required to support commercial fisheries has declined since 2000 -- * Commercial fishing engagement has increased in some communities, and New England commercial fisheries catch and revenue remain dependent on single species (lobster and scallops) -- * Commercial catch and revenue increased in 2018 (due to lobster and scallops) -- * Habitat models identified species most likely to occur in wind lease areas; habitat has improved in wind lease areas for NEFMC species except for Atlantic herring -- * While aggregate fish biomass is mainly stable over time (aside from high haddock), shifts to the northeast and into deeper water continue -- * Forage fish energy content varies by season and year; herring energy content may be half what it was in the 1980s-90s -- * Gulf stream instability produces more warm core rings with higher likelihood of warm salty water and associated species on the shelf -- * Almost no cold Labrador slope water has entered the Gulf of Maine for the last 3 years --- ## SOE Take Home Messages * The Gulf of Maine has changed over the past decade * Marine surface water heatwaves are increasing in duration and intensity, bottom temperatures and surface water is warming * Small zooplankton are more abundant than large fatty zooplankton favored by right whales * Spring blooms below average since 2013 -- * Georges Bank has also experienced warming and heat waves over the past decade * Surrounded by warm core rings in summer 2019 * Small zooplankton also dominant here * Average phytoplankton biomass in 2019 --- ## External Resources * [SOE Technical Documentation](https://noaa-edab.github.io/tech-doc) * [ecodata R package](https://github.com/noaa-edab/ecodata) * [Macrofauna indicators](http://noaa-edab.github.io/ecodata/macrofauna) * [Human Dimensions indicators](http://noaa-edab.github.io/ecodata/human_dimensions) * [Lower trophic level indicators](http://noaa-edab.github.io/ecodata/LTL) * [ERDDAP server](https://comet.nefsc.noaa.gov/erddap/index.html) * Slides available at https://noaa-edab.github.io/presentations/ --- ## Contributors - THANK YOU! The New England and Mid-Atlantic SOEs made possible by (at least) 38 contributors from 8 intstitutions .pull-left[ .contrib[ Donald Anderson (Woods Hole Oceanographic Institute) <br> Andy Beet<br> Patricia Clay<br> Lisa Colburn<br> Geret DePiper<br> Michael Fogarty<br> Paula Fratantoni <br> Kevin Friedland<br> Sarah Gaichas<br> Avijit Gangopadhyay (School for Marine Science and Technology, University of Massachusetts Dartmouth)<br> James Gartland (Virginia Institute of Marine Science)<br> Glen Gawarkiewicz (Woods Hole Oceanographic Institution)<br> Sean Hardison<br> Kimberly Hyde<br> Terry Joyce (Woods Hole Oceanographic Institute)<br> John Kocik<br> Steve Kress (National Audubon Society)<br> Scott Large ] ] .pull-right[ .contrib[ Don Lyons (National Audubon Society)<br> Ruth Boettcher (Virginia Department of Game and Inland Fisheries)<br> Young-Oh Kwon (Woods Hole Oceanographic Institute)<br> Zhuomin Chen (Woods Hole Oceanographic Institute)<br> Sean Lucey<br> Chris Melrose<br> Ryan Morse<br> Kimberly Murray<br> Chris Orphanides<br> Richard Pace<br> Charles Perretti<br> Vincent Saba<br> Laurel Smith<br> Mark Terceiro<br> John Walden<br> Harvey Walsh<br> Mark Wuenschel ] ] .center[  ] --- ## Appendix: Updated feeding guilds <table class="table" style="font-size: 12px; margin-left: auto; margin-right: auto;"> <caption style="font-size: initial !important;">Feeding guilds and management bodies.</caption> <thead> <tr> <th style="text-align:left;font-weight: bold;"> Guild </th> <th style="text-align:left;font-weight: bold;"> MAFMC </th> <th style="text-align:left;font-weight: bold;"> Joint </th> <th style="text-align:left;font-weight: bold;"> NEFMC </th> <th style="text-align:left;font-weight: bold;"> State or Other </th> </tr> </thead> <tbody> <tr> <td style="text-align:left;width: 2cm; "> Apex Predator </td> <td style="text-align:left;width: 4cm; "> NA </td> <td style="text-align:left;width: 2cm; "> NA </td> <td style="text-align:left;width: 5cm; "> NA </td> <td style="text-align:left;width: 6cm; "> bluefin tuna, shark uncl, swordfish, yellowfin tuna </td> </tr> <tr> <td style="text-align:left;width: 2cm; "> Piscivore </td> <td style="text-align:left;width: 4cm; "> bluefish, longfin squid, northern shortfin squid, summer flounder </td> <td style="text-align:left;width: 2cm; "> goosefish, spiny dogfish </td> <td style="text-align:left;width: 5cm; "> acadian redfish, atlantic cod, atlantic halibut, clearnose skate, little skate, offshore hake, pollock, red hake, silver hake, smooth skate, thorny skate, white hake, winter skate </td> <td style="text-align:left;width: 6cm; "> fourspot flounder, john dory, sea raven, striped bass, weakfish, windowpane </td> </tr> <tr> <td style="text-align:left;width: 2cm; "> Planktivore </td> <td style="text-align:left;width: 4cm; "> atlantic mackerel, butterfish </td> <td style="text-align:left;width: 2cm; "> NA </td> <td style="text-align:left;width: 5cm; "> atlantic herring </td> <td style="text-align:left;width: 6cm; "> alewife, american shad, blackbelly rosefish, blueback herring, cusk, longhorn sculpin, lumpfish, menhaden, northern sand lance, northern searobin, sculpin uncl </td> </tr> <tr> <td style="text-align:left;width: 2cm; "> Benthivore </td> <td style="text-align:left;width: 4cm; "> black sea bass, scup, tilefish </td> <td style="text-align:left;width: 2cm; "> NA </td> <td style="text-align:left;width: 5cm; "> american plaice, barndoor skate, crab,red deepsea, haddock, ocean pout, rosette skate, winter flounder, witch flounder, yellowtail flounder </td> <td style="text-align:left;width: 6cm; "> american lobster, atlantic wolffish, blue crab, cancer crab uncl, chain dogfish, cunner, jonah crab, lady crab, smooth dogfish, spider crab uncl, squid cuttlefish and octopod uncl, striped searobin, tautog </td> </tr> <tr> <td style="text-align:left;width: 2cm; "> Benthos </td> <td style="text-align:left;width: 4cm; "> atlantic surfclam, ocean quahog </td> <td style="text-align:left;width: 2cm; "> NA </td> <td style="text-align:left;width: 5cm; "> sea scallop </td> <td style="text-align:left;width: 6cm; "> blue mussel, channeled whelk, sea cucumber, sea urchin and sand dollar uncl, sea urchins, snails(conchs) </td> </tr> </tbody> </table> --- class: inverse background-image: url("EDAB_images/IMG_2809.jpg") background-size: cover ## Questions? Thank you! .pull-left[ Contacts: ] .pull-right[ sarah.gaichas@noaa.gov ]