class: right, middle, my-title, title-slide # Fishing within food webs: ## Modeling for management advice ### Sarah Gaichas<br /> Northeast Fisheries Science Center --- class: top, left ## What does modeling have to do with management?  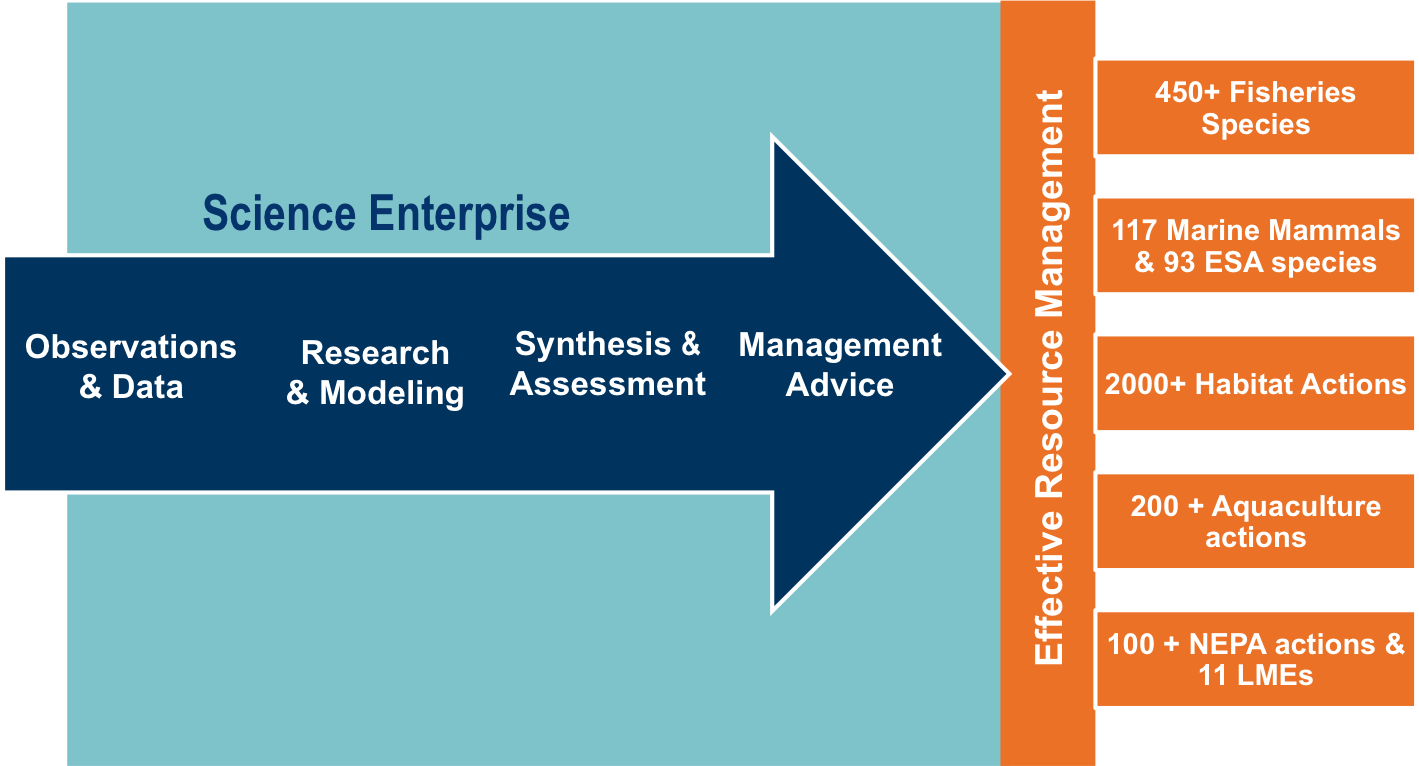 --- ## What kinds of models are there? 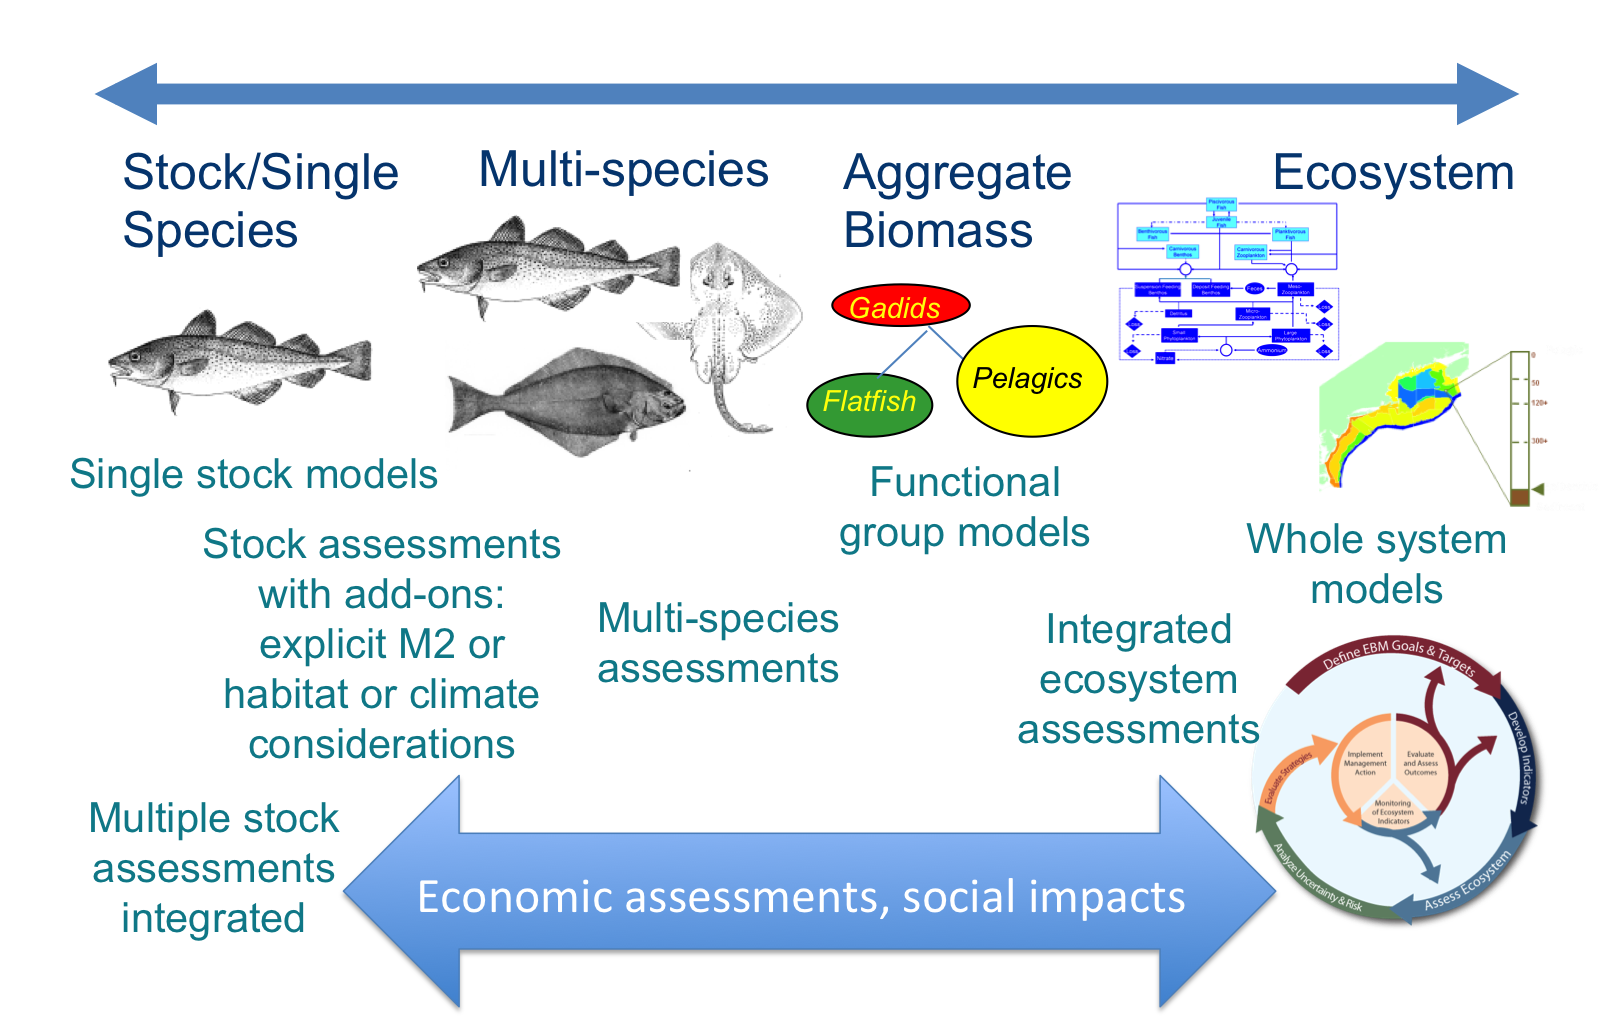 --- ## Which models are best for management decisions? (Conclusions!) .pull-left[ - Based on **clearly specified questions** (from managers/stakeholders) - **Outputs** and **controls designed** to answer the questions - Using **observations** directly from the ecosystem - With clear description of **uncertainties** ] .pull-right[  .footnote[https://xkcd.com/793/] ] --- ## Food webs and fisheries--two examples - Preface: What is a "forage fish"? - Alaska pollock: ecological research with a food web model *"How does ecosystem structure affect dynamics?"* - Distinguishing climate, fishing, and food web interactions - Dealing with uncertainty - Atlantic herring: fishery management strategy evaluation *"Which harvest control rules best consider herring's role as forage?"* - Balancing fishing benefits and ecological services - Diverse stakeholder interests - Needed timely answers! --- ## What is a forage fish? <img src="EDAB_images/forageSeattleTimes.png" width="67%" style="display: block; margin: auto;" /> --- ## How does ecosystem structure affect dynamics? 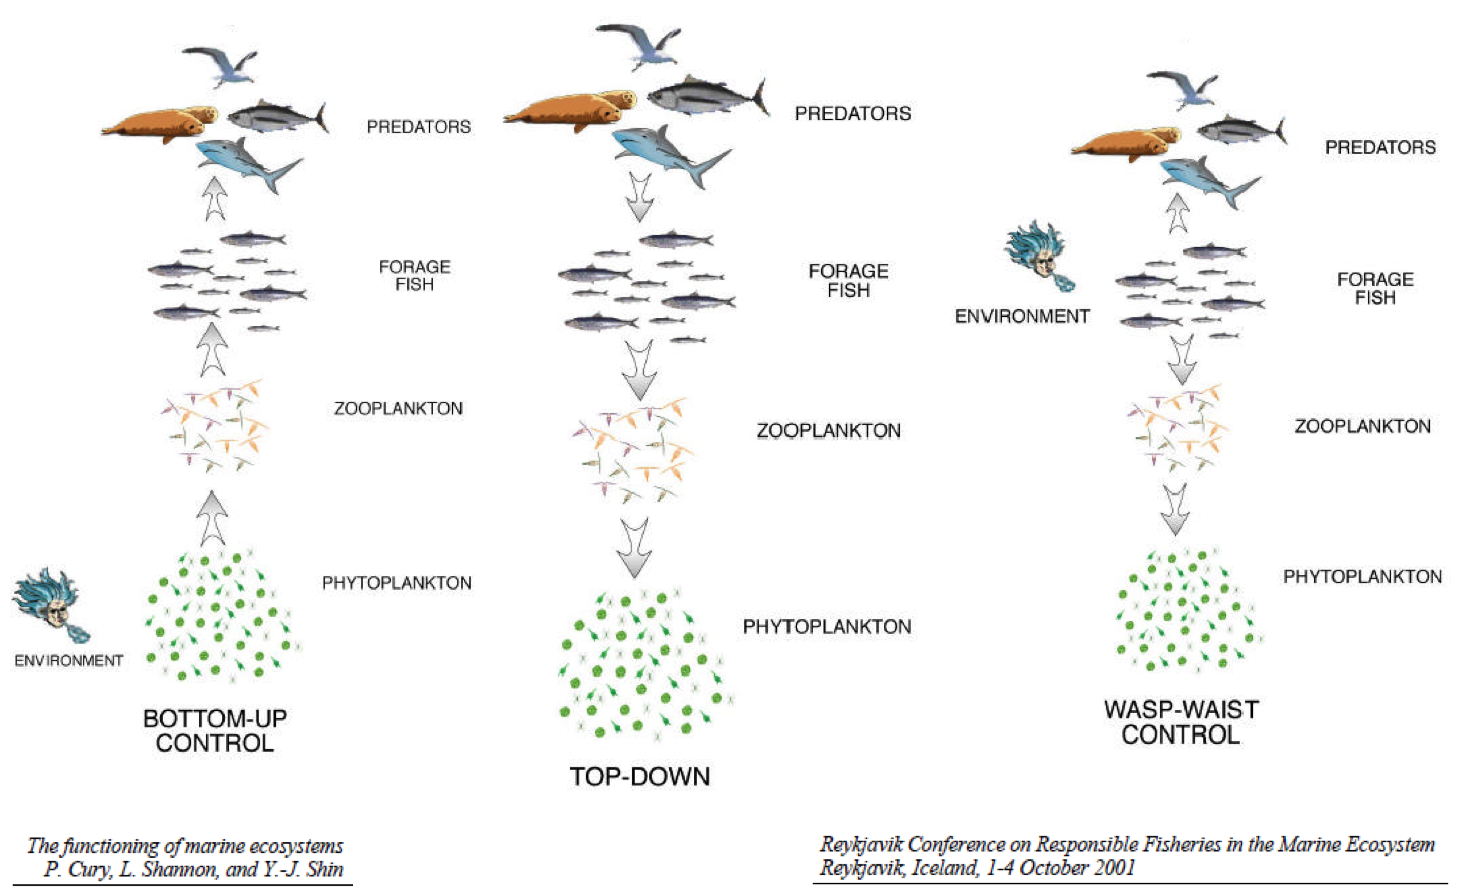 --- ## Alaska pollock: a tale of two ecosystems 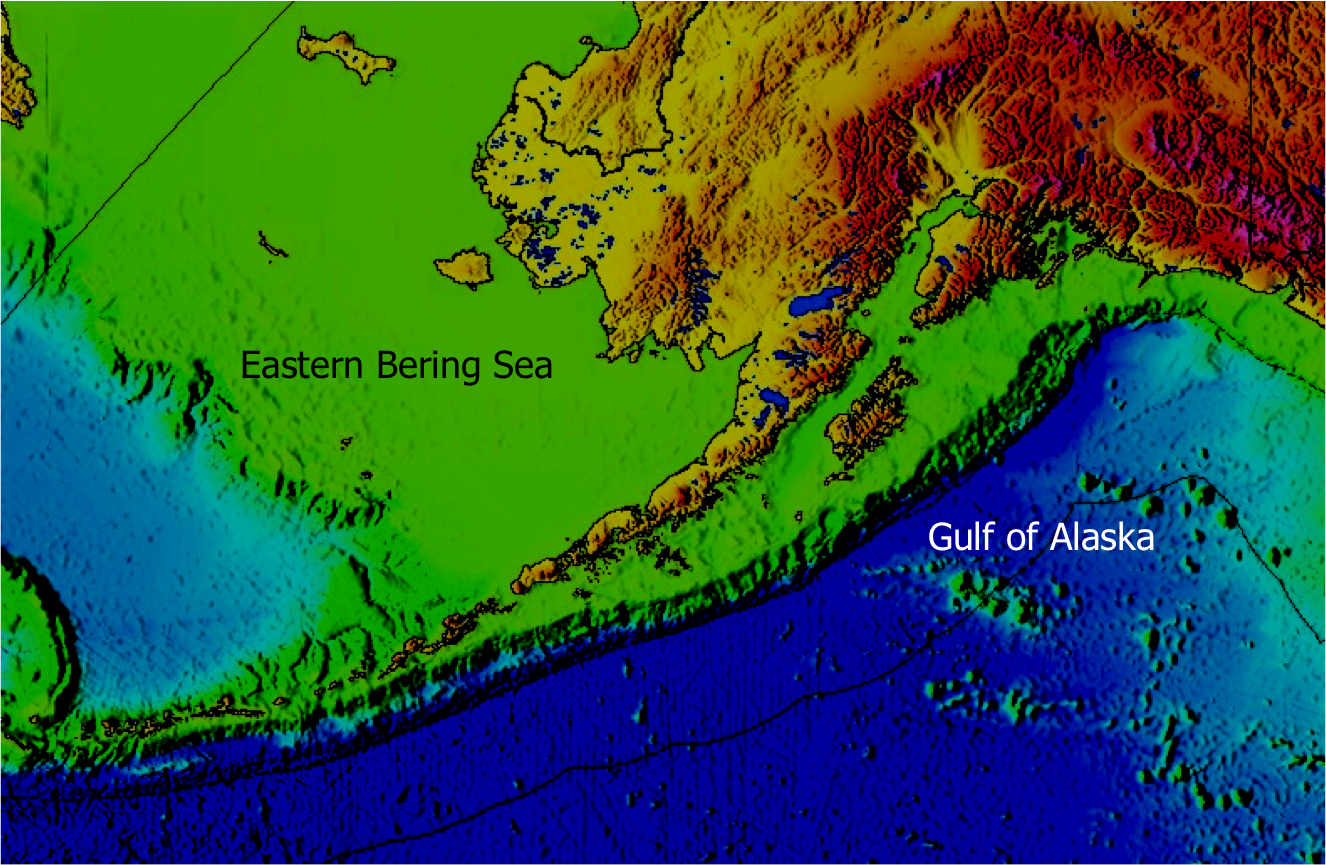 --- ## Alaska pollock: a tale of two ecosystems 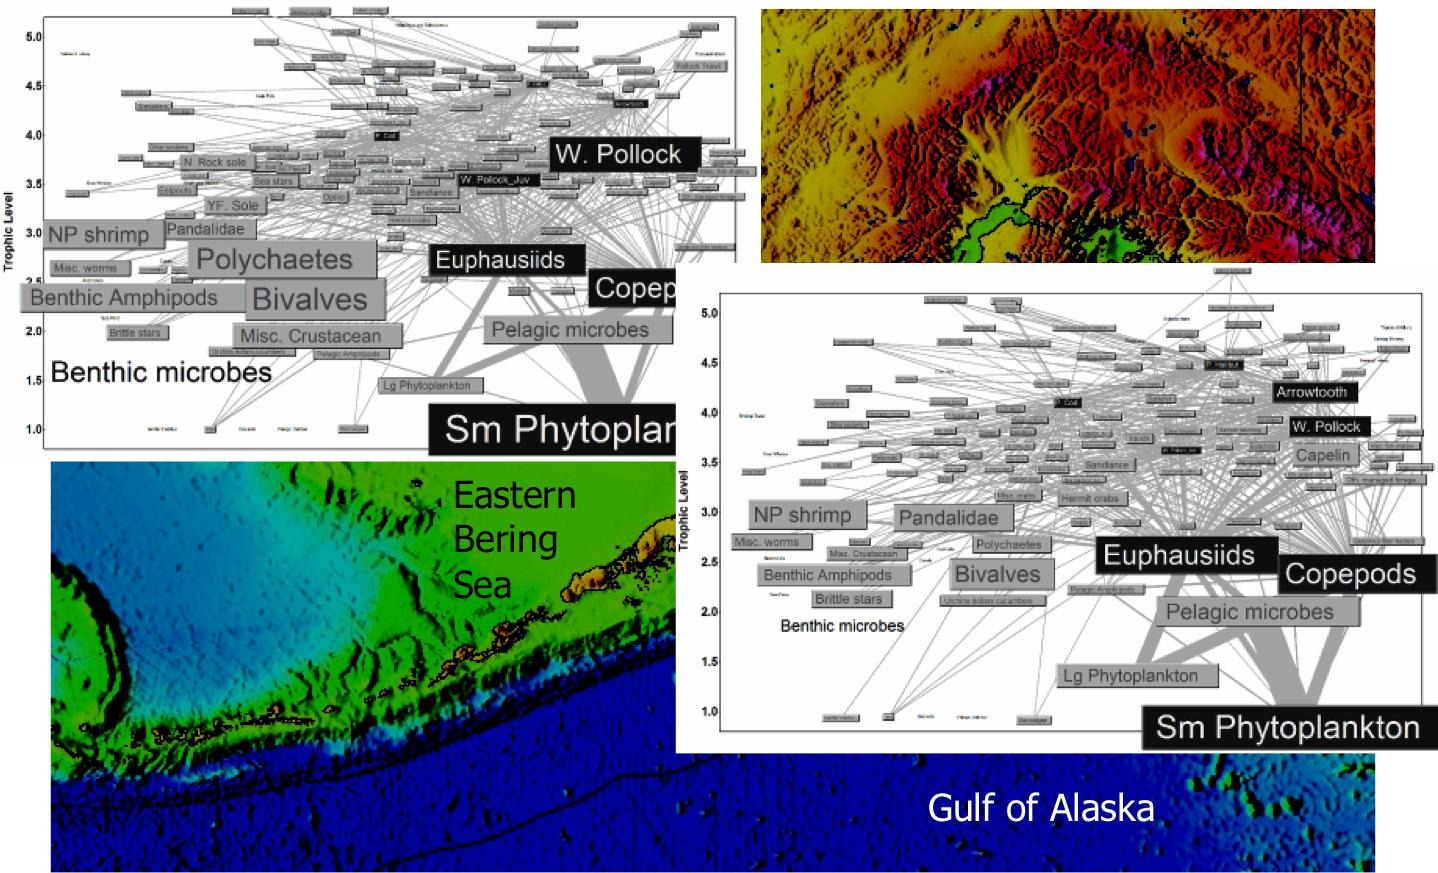 --- ## Alaska pollock: a tale of two ecosystems <img src="EDAB_images/EBSGOAbiodist.png" width="75%" style="display: block; margin: auto;" /> ??? Similar biomass groups up to TL 3 EBS pollock dominate at TL 3.5, highest biomass of any fish GOA has highest biomass above TL 4 (halibut, arrowtooth) --- ## Alaska pollock: a tale of two ecosystems .pull-left[ - Different pollock trajectories - Different pollock diets, mortality sources <img src="EDAB_images/pollpic.png" width="85%" style="display: block; margin: auto;" /> ] .pull-right[ <img src="EDAB_images/EBSGOApollassess.png" width="95%" style="display: block; margin: auto;" /> ] <img src="EDAB_images/EBSGOApolldietmort.png" width="95%" style="display: block; margin: auto;" /> ??? diets:- copepods, krill, pollock in EBS - krill, shrimp, some copepods in GOA --- ## Ecosystem models and uncertainty 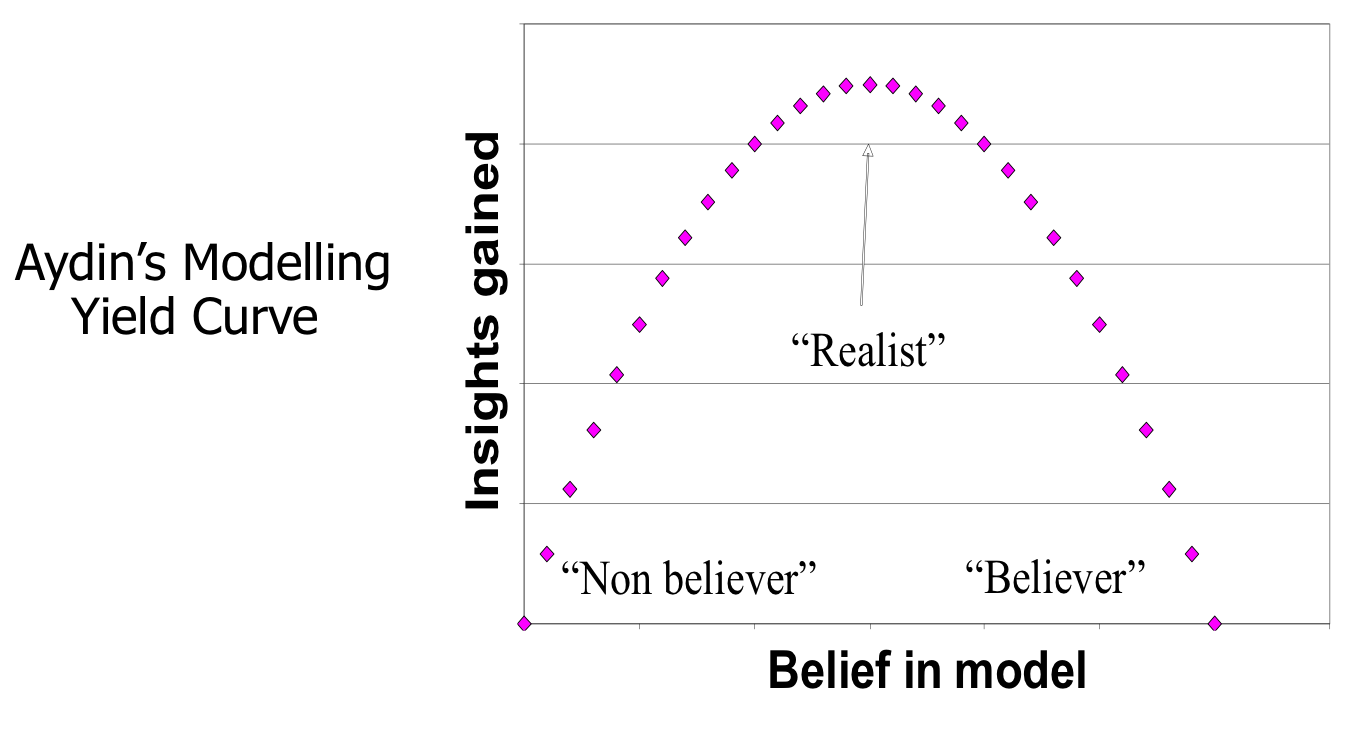 --- ## Model ensemble https://xkcd.com/1885/ 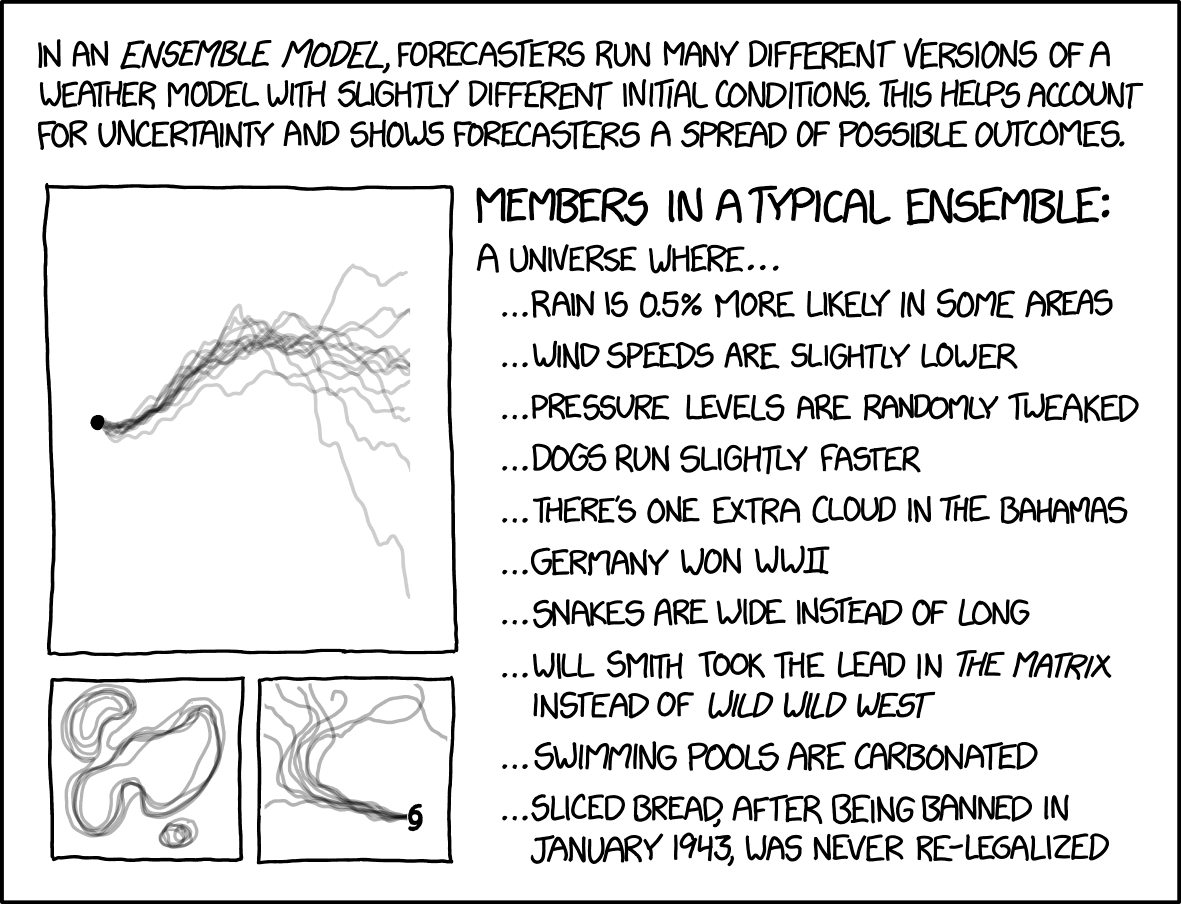 --- ## What is a food web model? .pull-left-60[ A system of linear equations For each group, `\(i\)`, specify: Biomass `\(B\)` [or Ecotrophic Efficiency `\(EE\)` ] Population growth rate `\(\frac{P}{B}\)` Consumption rate `\(\frac{Q}{B}\)` Diet composition `\(DC\)` Fishery catch `\(C\)` Biomass accumulation `\(BA\)` Im/emigration `\(IM\)` and `\(EM\)` Solving for `\(EE\)` [or `\(B\)` ] for each group: ] .pull-right-40[ 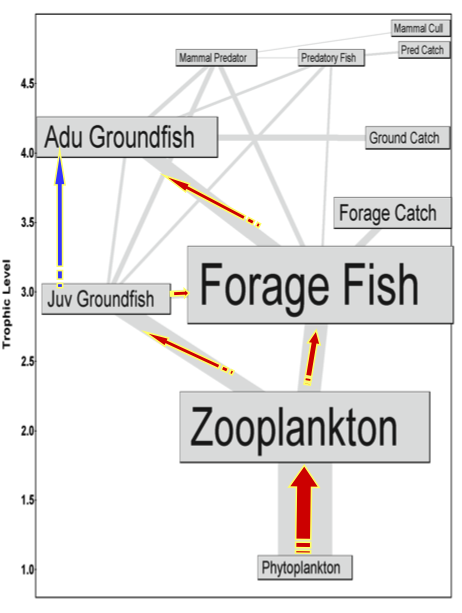 ] `$$B_i\Big(\frac{P}{B}\Big)_i*EE_i+IM_i+BA_i=\sum_{j}\Big[ B_j\Big (\frac{Q}{B}\Big)_j*DC_{ij}\Big ]+EM_i+C_i$$` ??? --- ## Ecosystem models and uncertainty: grading inputs 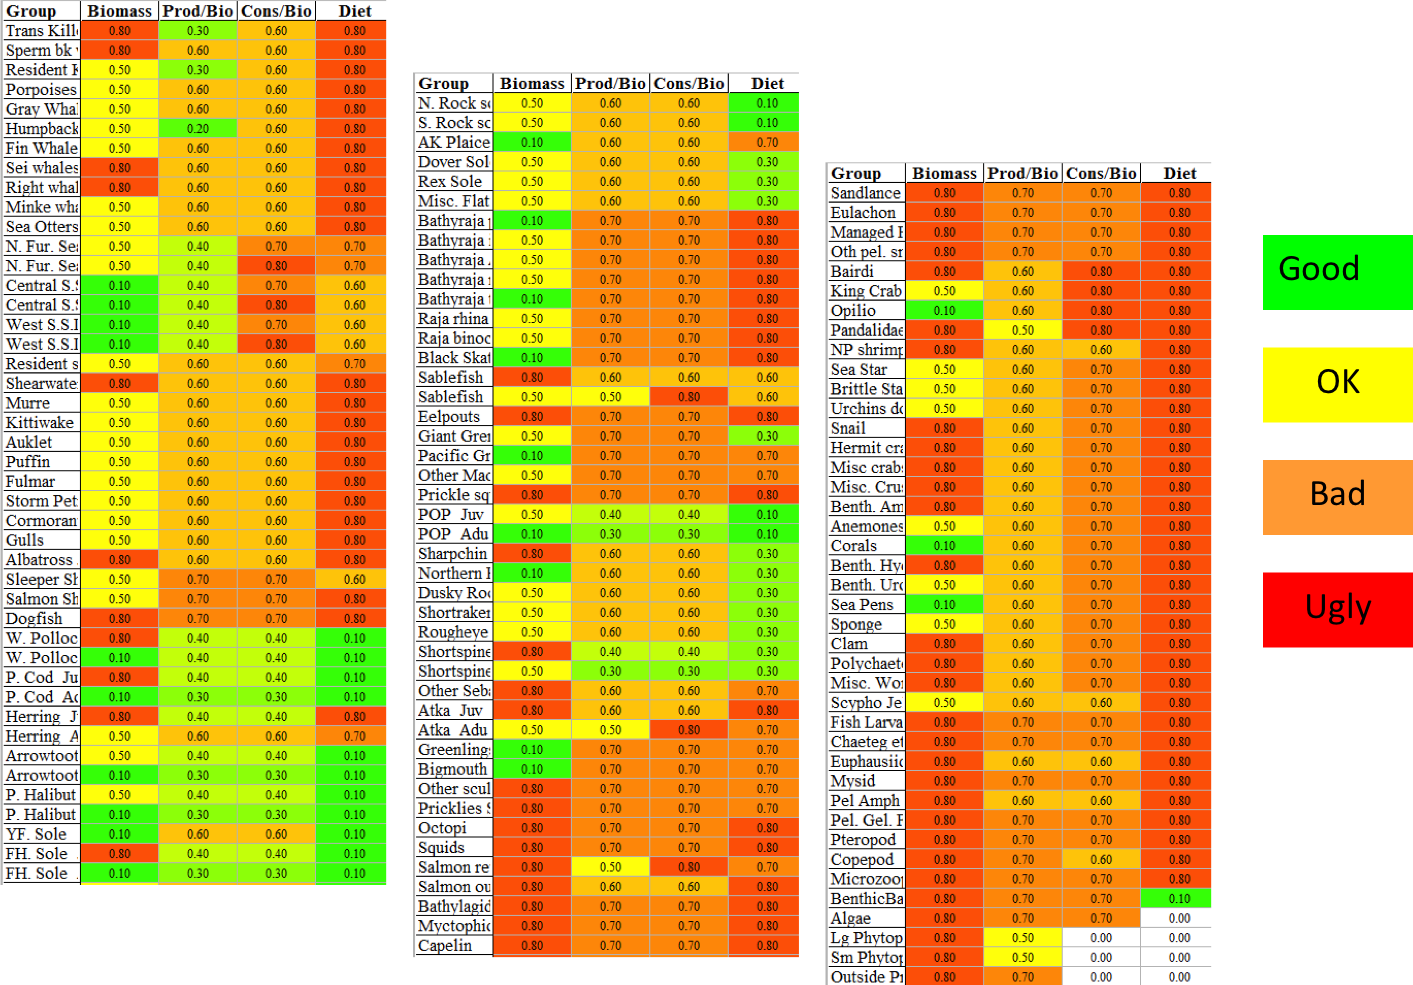 --- ## Ecosystem models and uncertainty: run a scenario 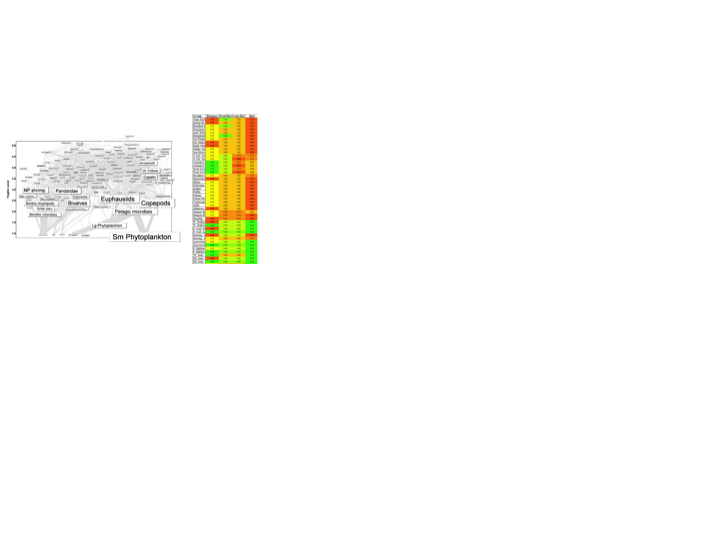 --- ## Ecosystem models and uncertainty: run a scenario 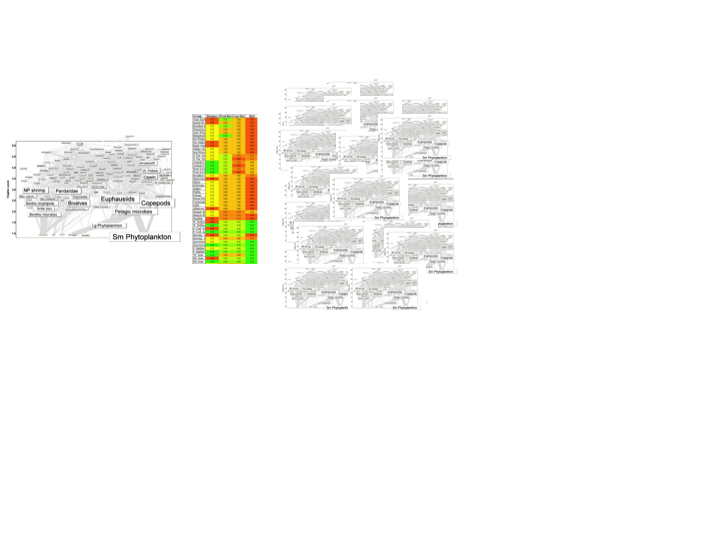 --- ## Ecosystem models and uncertainty: run a scenario 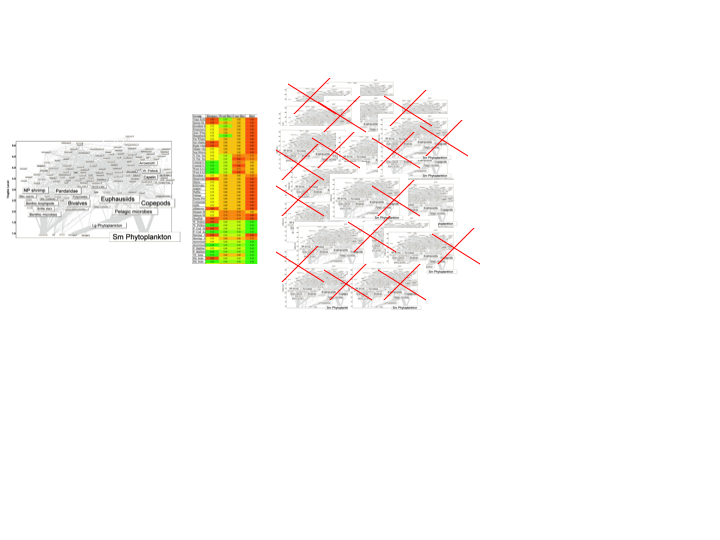 --- ## Ecosystem models and uncertainty: run a scenario in an ensemble 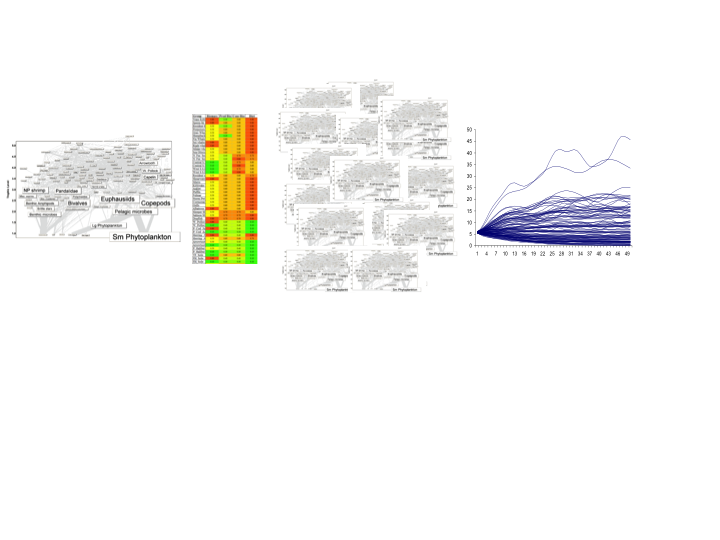 --- ## Ecosystem models and uncertainty: run a scenario in an ensemble 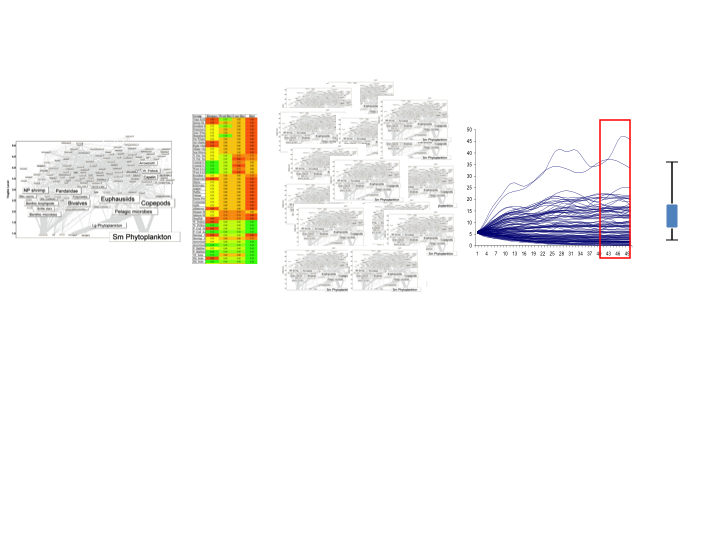 --- ## Ecosystem models and uncertainty: run a scenario in an ensemble 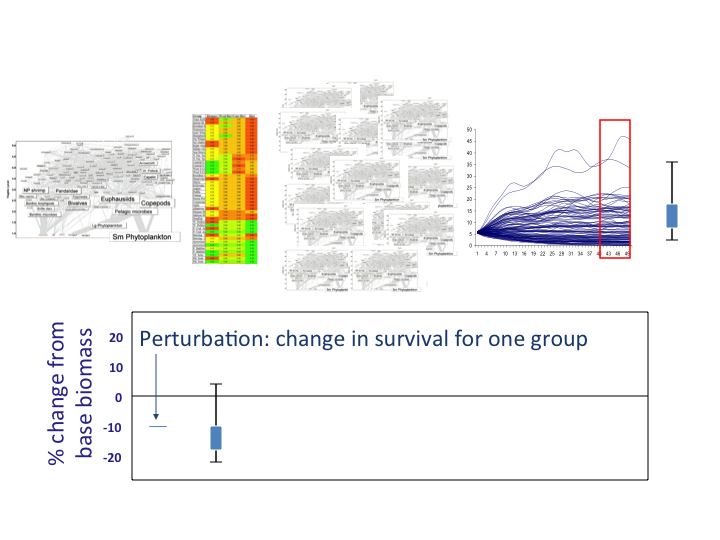 --- ## Ecosystem models and uncertainty: run a scenario in an ensemble 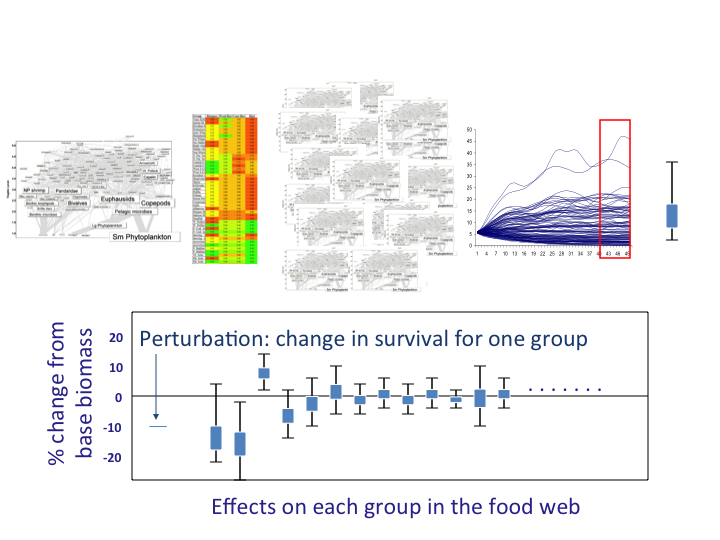 --- ## Defining ecosystem structure in the EBS and GOA: expectations Ecosystem reaction to pollock if pollock is a "wasp waist": 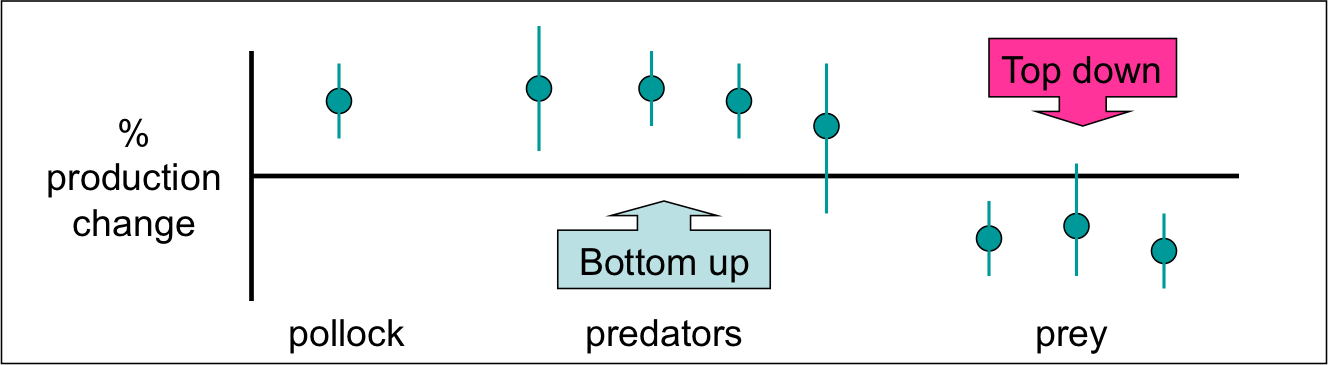 -- Pollock reaction to other groups if control is bottom up or top down: 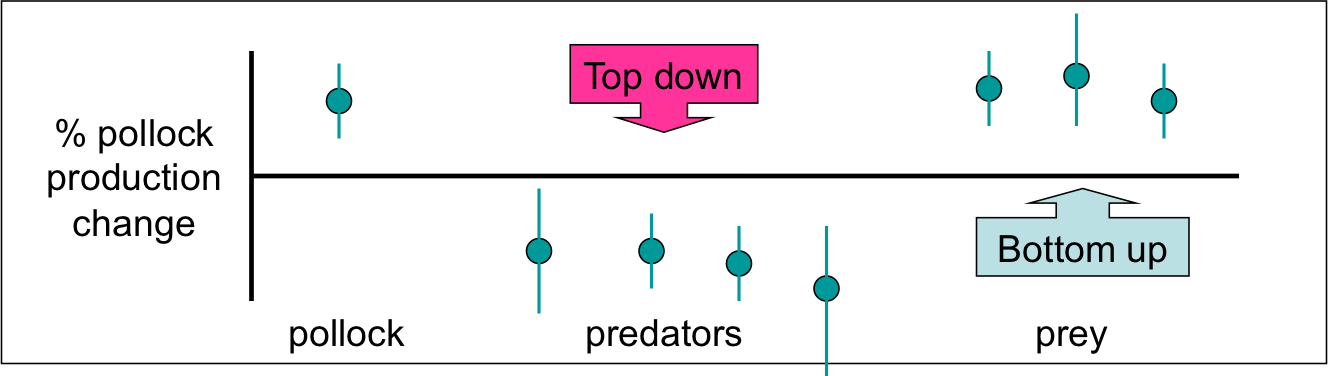 --- ## Perturbation results: ecosystem reaction to 10% pollock increase <img src="EDAB_images/Fig6.png" width="100%" style="display: block; margin: auto;" /> --- ## Perturbation results: pollock reaction to 10% increase in others <img src="EDAB_images/Fig7.png" width="100%" style="display: block; margin: auto;" /> --- ## Perturbation results: ecosystem reaction to 10% phytoplankton increase <img src="EDAB_images/Fig8.png" width="100%" style="display: block; margin: auto;" /> --- ## Simulated increased pollock fishing (significant changes only) <img src="EDAB_images/FigS4.png" width="100%" style="display: block; margin: auto;" /> --- ## Insights for fishery management - Differences in food web structure between two adjacent ecosystems with similar biological communities and fishery management - Which species respond to the same perturbation - Level of uncertainty / predictability in response - EBS: Influential group at mid trophic levels - Wasp waist transmits signal to other groups (neither AK system) - Self regulating dominant group (beer belly) absorbs signals - Beer belly systems are more predictable, stable as long as the beer belly maintains itself? - GOA: Influential groups at high trophic levels - Magnifies bottom up signals and top down? - A less predictable system? - Subject to more radical change? - Structure of a food web may determine how predictable a system is under perturbation, and how changes in primary production propagate through systems --- ## Are any Atlantic herring harvest control rules good for both fisheries and predators? <img src="EDAB_images/allcomponents.png" width="1701" /> --- ## What is Management Strategy Evaluation? <img src="EDAB_images/MSECSIRO.png" width="2000" /> --- ## The Dream and The Reality <img src="EDAB_images/MgtProcess.png" width="1824" /> --- ## Design: link models matching stakeholder-identified objectives <img src="EDAB_images/OMdesign.png" width="85%" style="display: block; margin: auto;" /> --- ## Design: multiple (herring) operating models spanning uncertainty <table class="table" style="margin-left: auto; margin-right: auto;"> <thead> <tr> <th style="text-align:left;"> Operating Model Name </th> <th style="text-align:left;"> Herring Productivity </th> <th style="text-align:left;"> Herring Growth </th> <th style="text-align:left;"> Assessment Bias </th> </tr> </thead> <tbody> <tr> <td style="text-align:left;"> LowFastBiased </td> <td style="text-align:left;"> Low: high M, low h (0.44) </td> <td style="text-align:left;"> 1976-1985: fast </td> <td style="text-align:left;"> 60% overestimate </td> </tr> <tr> <td style="text-align:left;"> LowSlowBiased </td> <td style="text-align:left;"> Low: high M, low h (0.44) </td> <td style="text-align:left;"> 2005-2014: slow </td> <td style="text-align:left;"> 60% overestimate </td> </tr> <tr> <td style="text-align:left;"> LowFastCorrect </td> <td style="text-align:left;"> Low: high M, low h (0.44) </td> <td style="text-align:left;"> 1976-1985: fast </td> <td style="text-align:left;"> None </td> </tr> <tr> <td style="text-align:left;"> LowSlowCorrect </td> <td style="text-align:left;"> Low: high M, low h (0.44) </td> <td style="text-align:left;"> 2005-2014: slow </td> <td style="text-align:left;"> None </td> </tr> <tr> <td style="text-align:left;"> HighFastBiased </td> <td style="text-align:left;"> High: low M, high h (0.79) </td> <td style="text-align:left;"> 1976-1985: fast </td> <td style="text-align:left;"> 60% overestimate </td> </tr> <tr> <td style="text-align:left;"> HighSlowBiased </td> <td style="text-align:left;"> High: low M, high h (0.79) </td> <td style="text-align:left;"> 2005-2014: slow </td> <td style="text-align:left;"> 60% overestimate </td> </tr> <tr> <td style="text-align:left;"> HighFastCorrect </td> <td style="text-align:left;"> High: low M, high h (0.79) </td> <td style="text-align:left;"> 1976-1985: fast </td> <td style="text-align:left;"> None </td> </tr> <tr> <td style="text-align:left;"> HighSlowCorrect </td> <td style="text-align:left;"> High: low M, high h (0.79) </td> <td style="text-align:left;"> 2005-2014: slow </td> <td style="text-align:left;"> None </td> </tr> </tbody> </table> ## Harvest control rules: Fishing mortality (F) based on: - Biomass (SSB) (1, 3, and 5 year blocks of catch) <!-- `$$\tilde{F}_y=\begin{cases}\psi F_{MSY}, & \text{if}\ \widehat{SSB}_y \geq SSB_{up} \\\psi F_{MSY} \frac{\widehat{SSB}_y - SSB_{low}}{SSB_{up}-SSB_{low}}, & \text{if}\ SSB_{low} < \widehat{SSB}_y < SSB_{up}\\0, & \text{if}\ \widehat{SSB}_y \leq SSB_{low}\end{cases}$$` --> - Biomass with a 15% restriction on interannual change - Constant Catch (proportion of MSY) - Conditional Constant Catch (not to exceed max F) --- ## Economics: Min-Yang Lee's talk last week - Some modeling, limited by project timeline - The dream: predator response links to ecosystem services, human well being - Fishery complexity rivals or exceeds that of food webs! .pull-left[  ] .pull-right[  ] --- ## Predators <img src="EDAB_images/herrtopreds.png" width="1848" /> --- ## Seabirds: data collected here! (and throughout Gulf of Maine) .pull-left[  ] .pull-right[  ] - Colony adult and fledgling count data used to develop population model - Chick diet observations examined in relation to fledgling success --- ## Terns and herring--developing a modeled relationship .pull-left[  ] .pull-right[  ] Although there were no clear significant relationships of common tern productivity and the proportion of herring in diets across all colonies, there were some correlations between herring total biomass and tern productivity. Hence, the relationship on the right was developed to relate herring biomass to common tern productivity. --- ## Testing the model--does it work?  --- ## Predator results summary <img src="EDAB_images/herrtopreds_results.png" width="1833" /> Three control rule types--Constant catch, conditional constant catch, and 15% restriction on change--were rejected at the second stakeholder meeting for poor fishery and predator performance. --- ## Food web modeling; supplemental results  Tradeoffs between forage groups apparent --- ## Compare 10% change with more extreme "herring" biomass  More uncertainty with increased herring biomass? --- ## Tradeoffs in Remaining Control Rules .pull-left[  ] .pull-right[  ] --- ## What control rules give us 90% of everything we want? - Tern productivity at 1.0 or above more than 90% of the time - Herring biomass more than 90% of SSBmsy - Fishery yield more than 90% of MSY - AND fishery closures (F=0) less than 1% of the time (second plot). .pull-left[ <!-- --> ] .pull-right[ <!-- --> ] --- ## What have we learned? Modeling allows us to test options .pull-left-30[ Complex food web, generalist predators - Herring is one of several important prey - Assessing multiple prey together will likely show stronger effects on predator productivity ] .pull-right-70[  ] - Tern/Tuna/Groundfish/Mammal productivity is also affected by predators, weather, and other factors not modeled here - Even relatively weak relationships still showed which herring control rules were poor - Managers did select a harvest control rule considering a wide range of factors! --- ## External Resources * [Wasp Waist or Beer Belly?](https://www.sciencedirect.com/science/article/pii/S0079661115002001) * [New England Atlantic herring management](https://www.nefmc.org/management-plans/herring) * [New England herring MSE stakeholder process paper](https://www.nrcresearchpress.com/doi/abs/10.1139/cjfas-2018-0125#.XTb_v5NKgWo) * [New England herring MSE modeling paper](https://www.nrcresearchpress.com/doi/10.1139/cjfas-2018-0128#.XTb_c5NKgWo) * [Rpath codebase](https://github.com/NOAA-EDAB/Rpath) * Slides available at https://noaa-edab.github.io/presentations --- background-image: url("EDAB_images/IMG_2733.jpg") background-size: cover ## Questions? # Thank you!