class: right, middle, my-title, title-slide # State of the Ecosystem: ## Mid-Atlantic 2019<br /> with updates to EAFM Risk Assessment ### Sarah Gaichas and Sean Hardison <br /> Ecosystem Dynamics and Assessment <br /> Northeast Fisheries Science Center --- class: top, left # Today's Talk .pull-left[ - Role of Ecosystem reporting in MAFMC EAFM - Report structure - Overview results for Mid-Atlantic 2019 - EAFM risk assessment update - Notable improvements: open-source data and technical documentation ] .pull-right[ *The IEA Loop<sup>1</sup>* 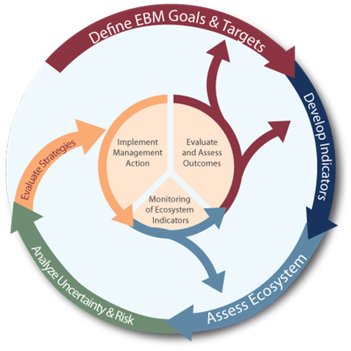 ] .footnote[ [1] https://www.integratedecosystemassessment.noaa.gov/national/IEA-approach ] ??? --- ## State of the Ecosystem (SOE) Reporting: Context for busy people *"So what?" --John Boreman, September 2016* 1. Clear linkage of ecosystem indicators with management objectives 1. Synthesis across indicators for big picture 1. Objectives related to human-well being placed first in report 1. Short (< 30 pages), non-technical (but rigorous) text 1. Emphasis on reproducibility <img src="20190320_MAFMC_SSC_Gaichas_images/nes-components-abstracted.png" width="60%" style="display: block; margin: auto;" /> ??? In 2016, we began taking steps to address these common critiques of the ESR model --- ## Mid-Atlantic Council Ecosystem Approach * 2016 EAFM Policy Guidance document; revised 2019<sup>1</sup> * MAFMC EAFM framework<sup>2</sup> <img src="20190320_MAFMC_SSC_Gaichas_images/Framework.png" width="60%" style="display: block; margin: auto;" /> * 2017 Inital EAFM risk assessment completed; revised and published 2018<sup>3</sup> * SOE indicators to be used for annual risk assessment updates .footnote[ [1] http://www.mafmc.org/s/EAFM-Doc-Revised-2019-02-08.pdf [2] https://www.frontiersin.org/articles/10.3389/fmars.2016.00105/full [3] https://www.frontiersin.org/articles/10.3389/fmars.2018.00442/full ] ??? --- ## State of the Ecosystem 2019: Structure .pull-left[ ### Report Structure 1. Human dimensions 2. Protected species 3. Fish and invertebrates (managed and otherwise) 4. Habitat quality and ecosystem productivity ] .pull-right[ .table[ <table class="table" style="width: 50; margin-left: auto; margin-right: auto;"> <caption>Ecosystem-scale objectives and indicators on the Northeast US shelf</caption> <thead> <tr> <th style="text-align:left;font-weight: bold;"> Objective Categories </th> <th style="text-align:left;font-weight: bold;"> Indicators </th> </tr> </thead> <tbody> <tr> <td style="text-align:left;"> Seafood Production </td> <td style="text-align:left;"> Landings by feeding guild </td> </tr> <tr> <td style="text-align:left;"> Profits </td> <td style="text-align:left;"> Revenue by feeding guild </td> </tr> <tr> <td style="text-align:left;"> Recreation </td> <td style="text-align:left;"> Number of anglers and trips; recreational catch </td> </tr> <tr> <td style="text-align:left;"> Stability </td> <td style="text-align:left;"> Diversity indices (fishery and species) </td> </tr> <tr> <td style="text-align:left;"> Social & Cultural </td> <td style="text-align:left;"> Commercial and recreational reliance </td> </tr> <tr> <td style="text-align:left;"> Biomass </td> <td style="text-align:left;"> Biomass or abundance by feeding guild from surveys </td> </tr> <tr> <td style="text-align:left;"> Productivity </td> <td style="text-align:left;"> Condition and recruitment of managed species </td> </tr> <tr> <td style="text-align:left;"> Trophic structure </td> <td style="text-align:left;"> Relative biomass of feeding guilds, primary productivity </td> </tr> <tr> <td style="text-align:left;"> Habitat </td> <td style="text-align:left;"> Estuarine and offshore habitat conditions </td> </tr> </tbody> </table> ] ] --- ## SOE Orientation: Indicator visualization Status (short-term) and trend (long-term) of components are measured as **indicators** and plotted in a standardized way Indicators are selected to 1. Be broadly informative about a component in a management context<sup>1-3</sup> 1. Minimize redundancy of information 1. Be responsive to ecosystem change <img src="20190320_MAFMC_SSC_Gaichas_files/figure-html/doc-orientation-1.png" style="display: block; margin: auto;" /> .footnote[ [1] Rice J. C.Rochet M. J. "A framework for selecting a suite of indicators for fisheries management." ICES Journal of Marine Science 62 (2005): 516–527. [2] Link J. 2010. Ecosystem-Based Fisheries Management: Confronting Tradeoffs . Cambridge University Press, New York. [3] Zador, Stephani G., et al. "Ecosystem considerations in Alaska: the value of qualitative assessments." ICES Journal of Marine Science 74.1 (2017): 421-430. ] --- ## SOE Orientation: Indicator spatial scales <img src="20190320_MAFMC_SSC_Gaichas_images/SOE_Map.jpg" width="70%" style="display: block; margin: auto;" /> .footnote[ https://noaa-edab.github.io/tech-memo/epu.html ] ??? Indicators --- ## SOE Orientation: Feeding guilds .table[ <table class="table table-striped table-hover" style="margin-left: auto; margin-right: auto;"> <caption>Feeding guilds and management bodies.</caption> <thead> <tr> <th style="text-align:left;"> Guild </th> <th style="text-align:left;"> MAFMC </th> <th style="text-align:left;"> Joint </th> <th style="text-align:left;"> NEFMC </th> <th style="text-align:left;"> State or Other </th> </tr> </thead> <tbody> <tr> <td style="text-align:left;width: 2cm; "> Apex Predator </td> <td style="text-align:left;width: 4cm; "> NA </td> <td style="text-align:left;width: 2cm; "> NA </td> <td style="text-align:left;width: 5cm; "> NA </td> <td style="text-align:left;width: 6cm; "> bluefin tuna, shark uncl, swordfish, yellowfin tuna </td> </tr> <tr> <td style="text-align:left;width: 2cm; "> Piscivore </td> <td style="text-align:left;width: 4cm; "> bluefish, summer flounder </td> <td style="text-align:left;width: 2cm; "> goosefish, spiny dogfish </td> <td style="text-align:left;width: 5cm; "> acadian redfish, atlantic cod, atlantic halibut, clearnose skate, little skate, offshore hake, pollock, red hake, silver hake, smooth skate, thorny skate, white hake, winter skate </td> <td style="text-align:left;width: 6cm; "> fourspot flounder, john dory, sea raven, striped bass, weakfish, windowpane </td> </tr> <tr> <td style="text-align:left;width: 2cm; "> Planktivore </td> <td style="text-align:left;width: 4cm; "> atlantic mackerel, butterfish, longfin squid, northern shortfin squid </td> <td style="text-align:left;width: 2cm; "> NA </td> <td style="text-align:left;width: 5cm; "> atlantic herring </td> <td style="text-align:left;width: 6cm; "> alewife, american shad, blackbelly rosefish, blueback herring, cusk, longhorn sculpin, lumpfish, menhaden, northern sand lance, northern searobin, sculpin uncl </td> </tr> <tr> <td style="text-align:left;width: 2cm; "> Benthivore </td> <td style="text-align:left;width: 4cm; "> black sea bass, scup, tilefish </td> <td style="text-align:left;width: 2cm; "> NA </td> <td style="text-align:left;width: 5cm; "> american plaice, barndoor skate, crab,red deepsea, haddock, ocean pout, rosette skate, winter flounder, witch flounder, yellowtail flounder </td> <td style="text-align:left;width: 6cm; "> american lobster, atlantic wolffish, blue crab, cancer crab uncl, chain dogfish, cunner, jonah crab, lady crab, smooth dogfish, spider crab uncl, squid cuttlefish and octopod uncl, striped searobin, tautog </td> </tr> <tr> <td style="text-align:left;width: 2cm; "> Benthos </td> <td style="text-align:left;width: 4cm; "> atlantic surfclam, ocean quahog </td> <td style="text-align:left;width: 2cm; "> NA </td> <td style="text-align:left;width: 5cm; "> sea scallop </td> <td style="text-align:left;width: 6cm; "> blue mussel, channeled whelk, sea cucumber, sea urchin and sand dollar uncl, sea urchins, snails(conchs) </td> </tr> </tbody> </table> ] ??? * Feeding guilds assigned based on NEFSC food habits data base * Food habits change with age and size, so guilds assigned based on most common size class * Simplified from existing guild structures<sup>1,2</sup> .footnote[ [1] Garrison, Lance P, and Jason S Link. 2000. “Dietary guild structure of the fish community in the Northeast United States continental shelf ecosystem.” Marine Ecology Progress Series 202:231–40. [2] Link, Jason S, Carolyn A Griswold, Elizabeth T Methratta, and Jessie Gunnard. 2006. Documentation for the energy modeling and analysis exercise (EMAX). US Department of Commerce, National Oceanic; Atmospheric Administration. ] Because we focus on ecosystem context, we've aggregated species in most of our indicators up to the level of feeding guild, shown here. These feeding guilds were derived from NEFSC food habits data and existing guilds identified in the literature --- ## SOE 2019 Overview Results <img src="20190320_MAFMC_SSC_Gaichas_images/nes-components.png" width="1973" /> ??? The purpose of this report is to synthesize available information relevant to fishery management in the Mid-Atlantic portion of the US Northeast Shelf. This 2019 report highlights where management interventions have proven successful to achieve ecological objectives, but also characterizes the considerable challenges for management posed by climate change and increasing trade-offs across conservation, fishing, and other human activities in this region. Finally, we describe combinations of ecological signals that present opportunities for further integrated research and possibly creative management solutions. --- ## Good news: Management works (I) Evidence suggests that management limiting nutrient inputs has significantly improved water quality in Chesapeake Bay **Chesapeake Bay Water Quality** <img src="20190320_MAFMC_SSC_Gaichas_files/figure-html/cb-water-qual-1.png" style="display: block; margin: auto;" /> ??? First indicator I'd like to talk about is a new water quality for Chesapeake Bay, which many resource species use as nursery habitat or are dependent upon (e.g. bluefish, striped bass, menhaden, black sea bass) These data, which were provided by collaborators at the Chesapeake Bay Program, represent the percent of tidal waters in Chesapeake Bay meeting water quality standards for chlorophyll a, submerged aquatic vegetation, and dissolved oxygen. The increase in water quality for the Bay has been tied to management action limiting nutrient influx into the watershed, and improvments in dissolved oxygen and water clarity. --- ## Good news: Management works (II) Current bycatch levels suggest that management actions have been effective in reducing harbor porpoise bycatch <img src="20190320_MAFMC_SSC_Gaichas_files/figure-html/harbor-porpoise-bars-1.png" style="display: block; margin: auto;" /> ??? The maps here show density estimates of the widely distributed harbor porpoise in the spring and fall months, as estimated by the Atlantic Marine Assessment Program for Protected Species. The red line in the time series plot shows the potential biological removal. Above this line removals from the population will prevent the stock from reaching a stable population size. 2016 and 2017 estimates for bycacth are among the lowest values in the series, suggest that management actions have been effective in reducing harbor porpoise bycatch. --- ## Harvested species (mostly) meeting B and F objectives * Atlantic mackerel stock above F/Fmsy and below 0.5 B/Bmsy * Summer flounder status improved in recent benchmark <img src="20190320_MAFMC_SSC_Gaichas_files/figure-html/stock-status-1.png" style="display: block; margin: auto;" /> ??? Plot shows the ratio of stock mortality (F) to stock mortality at maximum sustainable yield, where a number larger than one indicates the stock is experiencing unsustainable fishing pressure. On the x axis we have the ratio of estimated stock biomass to biomass at maximum sustainable yield. --- ## Challenges: Long term decline in seafood production **Commercial fisheries landings: total and by guild** .pull-left[ MAB: * Total managed and non-managed landings in MAB are declining, playing out as declines in most feeding guild landings * Increase in benthivore landings (scup, black sea bass, tilefish) 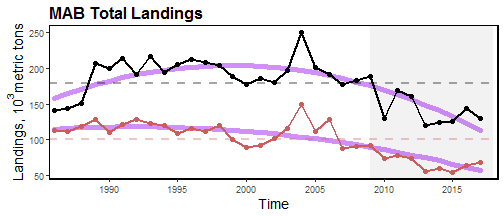<!-- --> ] .pull-right[ 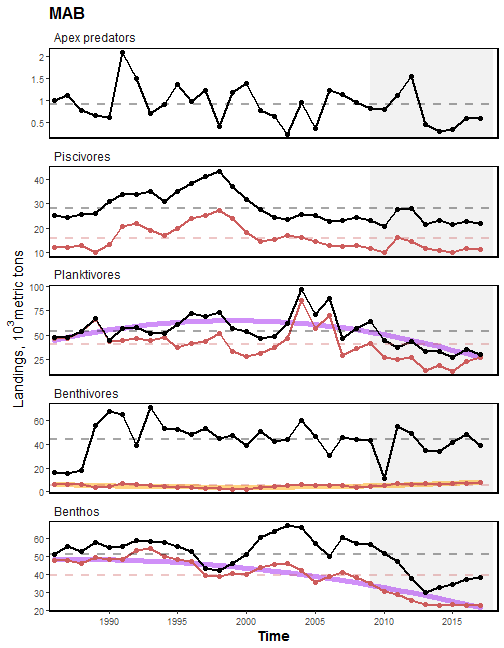<!-- --> ] --- ## Challenges: Long term decline in commercial revenue **Commercial fisheries: Total revenue, with price and volume components** .pull-left[ MAB: * Total revenue of managed species shows negative trend 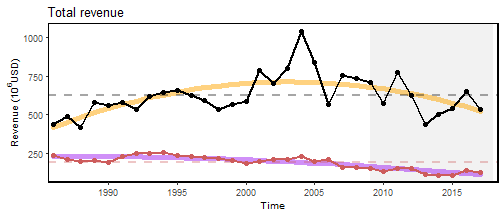<!-- --> ] .pull-right[ * Driven by decreased landings volume outweighing increased prices for benthos, planktivores, and other species groups <!-- --> ] --- ## Challenges: Decreased diversity in the recreational sector .pull-left[ MAB: * Overall decline in rec seafood harvest since 1980s * Trending upwards since mid-90s * Increase in recreational effort (n anglers) since the mid 90s * Decreasing diversity indicators * Fleet effort diversity driven by fewer party boats (24% of all trips down to 6%) * Species diversity does not break out the SAFMC-managed species--should it? ] .pull-right[ <!-- --> ] ??? Similar to NE, there's been a slight increase in recreational catch since the 90s in the Mid-Atlantic, along with a general increase in effort. However, different from NE, there are significant downward trends in fleet effort diversity and diversity of catch. While a decline in fleet effort diversity is due to fewer party boats, we can't be sure why there's been a decline in diversity of catch, as South Atlantic FMC species are not tracked seperately. --- ## Risk of high reliance on climate-vulnerable species **Community engagement and reliance on commercial fisheries** .pull-left[ MAB: * High social-ecological reliance on scallop commercial fisheries * Species considered moderately to highly at risk due to climate change (OA, temp) * Aquaculture in the MAB is also dominated by shellfish (oysters) ] .pull-right[ <!-- --> ] ??? Virginia continues to lead the country in oyster production, with aquaculture in the region growing quickly. The time series looks flat compared to Virginia, but oyster aquaculture in New Jersey is also growing. --- ## Risk of changing species diversity for recreational fishing? **Recreational engagement and reliance** .pull-left[ * Downward trend in recreational catch diversity may threaten fishing community stability in Mid-Atlantic (caveat: should SAFMC species be separated?) * Engaged and reliant communities in New England could benefit from higher diversity of catch observed (see New England report) ] .pull-right[ <!-- --> ] --- ## Challenges: Protected species interactions * 2018: 4 unusual mortality events for three large whale species and two seal species **North Atlantic right whales (NARW)** * Strong consensus of population decline * Diverging abundance trends between sexes, with higher female mortality rates * Evidence suggests that the level of interaction between NARWs, fixed gear (US and CAN) is contributing to the decline of the species * 20 NARW deaths in 2017 and 2018, >50% due to human interactions (5 vessel strike, 6 entanglement) <img src="20190320_MAFMC_SSC_Gaichas_files/figure-html/NARW-abundance-1.png" style="display: block; margin: auto;" /> ??? The North Atlantic right whale is among the most endangered whales in the world, with less than 450 individuals remaining and declining abundance trends. Evidence suggests that interactions with fisheries are contributing to the decline of the fisheries. Between 2017 and 2018, there were 20 known right whale mortality events, and more than half of these were the direct result of entanglement or vessel strike. Right whale distributions may also be changing with climate related distribution shifts of their main food source, Calanus finmarchicus. --- ## Challenge: Unprecedented ecosystem observations * Northeast US shelf is still among the fastest warming waters globally * 7/10 warmest years observed in the past decade * Most northerly Gulf Stream north wall positions ever recorded 2014-2017 * associated with warmer ocean temperature in the Northeast US shelf Advice for managing in the face of rapid, unprecedented ecosystem changes? .pull-left[ 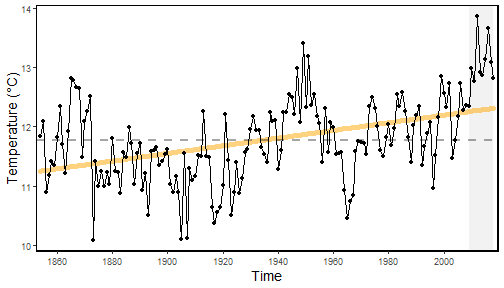<!-- --> *NE Shelf Long-term SST* ] .pull-right[ 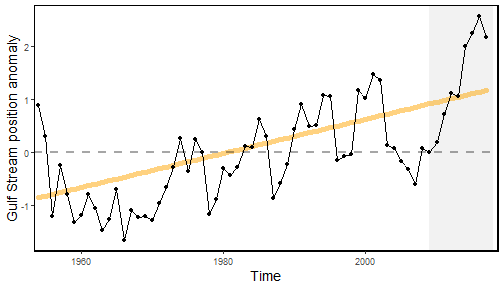<!-- --> *Gulf Stream Index* ] ??? SST Figure on left shows estimated time series of SST extending back to to 1850s. *7 out of 10 of the hottest years have been in the past decade GSI The figure on the right shows that deviation from the mean latitude of the north wall of the gulf stream, showing anomalously high value for the past 5 years These things are important for managers to know about because they directly influence stock distribution dynamics --- ## Challenge: Mid-Atlantic is warming * Mid-Atlantic summer 2018 SSTs were 3rd highest on record * Bottom temperature increasing as well, past 6 years all above average <img src="20190320_MAFMC_SSC_Gaichas_images/sst-anom.png" width="1441" style="display: block; margin: auto;" /> ??? The same is true for the Mid-Atlantic Bight As I noted earlier, some species in the Mid-Atlantic could actually see range expansions due to warming ocean temperatures, including croaker and striped bass. --- ## Management implications: species shifts <img src="20190320_MAFMC_SSC_Gaichas_files/figure-html/spec_prop-1.png" style="display: block; margin: auto;" /> ??? Traditional fisheries management is based around stable species distributions, but those distributions aren't static, and especially not in the context of changing ecosystem conditions The NEFSC has run a bottom trawl survey since the early 1960s, and these figures highlight how distributions of managed species within feeding guilds have changed. The decline in NEFMC species in the mid survey is driven mostly by ocean pout, which has seen proportional declines in the gulf of maine and georges bank survey .footnote[ https://seanhardison.shinyapps.io/surv_app/ --- ## Comparing inshore and offshore surveys **Bottom trawl surveys: Mid-Atlantic** .pull-left[ * NEFSC bottom trawl survey data paired with NEAMAP inshore bottom trawl data from the region * Opposing trends in piscivore biomass during the spring and fall seasons for the offshore survey * As temperature and ocean circulation indicators trend toward extremes, fishery management based on static stock areas will likely face continued changes in species distribution ] .pull-right[ <img src="20190320_MAFMC_SSC_Gaichas_files/figure-html/ma-survey-1.png" width="100%" /> ] .footnote[ [1] [View all survey data](https://noaa-edab.github.io/ecodata/macrofauna) [2] [Explore survey proportions](https://seanhardison.shinyapps.io/surv_app/) ] ??? For the Mid, we show offshore bottom trawl survey data paired with inshore bottom trawl data collected in the region by Northeast Area Monitoring and Assessment Program. There appear to be opposing trends in spring piscivore biomass between the two surveys, which could reflect higher prevalence of spiny dogfish offshore We didn't include the data in this presentation, but we also recieved inshore survey data from the Maine/New Hampshire survey and Mass state survey, and we hope to take a deeper look over the next SOE cycle --- ## Changing base of the food web: primary production * Summer PP is increasing in the Mid-Atlantic (and in New England) * Driven by warmer temperatures and increased bacterial remineralization and nutrient recycling * Increasing primary production likely due to higher productivity of smaller phytoplankton 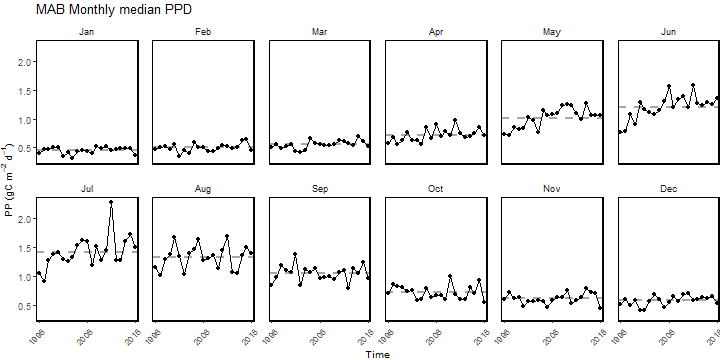<!-- --> ??? * Driven by warmer temperatures and increased bacterial remineralization and nutrient recycling * Increasing primary production likely due to higher productivity of smaller phytoplankton --- ## Changing base of the food web: zooplankton * Seasonal abundances of key zooplankton species * Opposing trends in <i>Centropages</i> in spring and fall, which corresponds to a shift in timing of their peak concentration from late fall to early spring<sup>1</sup> <img src="20190320_MAFMC_SSC_Gaichas_files/figure-html/seasonal-zoo-1.png" style="display: block; margin: auto;" /> .footnote[ [1] Bi H, Ji R, Liu H, Jo Y-H, Hare JA. Decadal Changes in Zooplankton of the Northeast U.S. Continental Shelf. PLOS ONE. 2014;9: e87720. doi:10.1371/journal.pone.0087720 ] --- ## Changing base of the food web **Primary production and copepod size structure** * Lower copepod size index means higher abundance of large copepods (<i>Calanus</i>) * Primary production may play a role in zooplankton size dynamics on the shelf <img src="20190320_MAFMC_SSC_Gaichas_files/figure-html/MAB-sli-1.png" style="display: block; margin: auto;" /> ??? To assess the size structure of copepods in the region, we use the small-large index. * A measure of relative size composition of the dominant copepod taxa * A lower value means higher abundance of large copepods (<i>Calanus</i>) * Primary production may play a role in copepod size dynamics*** --- ## Changing base of the food web and fish conditions * Fish condition is measured at the weight at a given length relative to the average * drop-off in condition around 2000 aligns with the shift in zooplankton size-structure on the shelf *MAFMC Condition Factor* <img src="20190320_MAFMC_SSC_Gaichas_images/MAFMC_Fish_Condition_2019.jpg" width="95%" style="display: block; margin: auto;" /> ??? Looking at condition in aggregate across all managed stocks, we can see a clear decline in condition between 2000-2010 Recent improvement within past decade Interestingly, the drop-off in condition around 2000 resembles a shift in zooplankton size-structure on the shelf, and this is a topic for future research --- ## Changing base of the food web and fish productivity * During the 1990s and early 2000s, high relative abundance of smaller bodied copepods and a lower relative abundance of *Calanus finmarchicus* coincided with regime shifts to lower fish recruitment<sup>1</sup> <img src="20190320_MAFMC_SSC_Gaichas_files/figure-html/fish-prod-1.png" style="display: block; margin: auto;" /> .footnote[ [1] Perretti, C., Fogarty, M., Friedland, K., Hare, J., Lucey, S., McBride, R., Miller, T., et al. 2017. Regime shifts in fish recruitment on the Northeast US Continental Shelf. Marine Ecology Progress Series, 574: 1–11. ] ??? In the Mid, there seems to be a decline in productivity in recent years, due to changes in recruitment and survival. In the past 5 years, strong productivity years for witch flounder, silver hake, and winter flounder have driven increases --- ## EAFM Risk Assessment update (I) ### Decreased Risk * Summer flounder fishing mortality (F) status has improved from high risk (F>Fmsy) to low risk (F<Fmsy) based on the new benchmark assessment * Updated commercial fleet diversity (fleet count and fleet diversity) have no long term trends, thus improving from moderate-high risk to low risk according to risk criteria for this element ### Increased Risk * No indicators for individual elements have changed enough to warrant increased risk rankings according to the Council risk critiera * But see caveats regarding analyses that were not updated --- ## EAFM Risk Assessment update (II) ### Re-evaluate Risk * Indicators for recreational opportunities based on updated Marine Recreational Information Program (MRIP) data show generally similar patterns of decreased angler days and trips over the past 10 years, but the declines are less pronounced than measured previously. A reduction from the highest risk ranking to a lower risk category may be warranted. ### New Risk Indicators * Recreational diversity indicators (fleet and species) to be considered * Chesapeake Bay water quality could be added to estuarine habitat element --- ## EAFM Risk Assessment: Updated Risk Rankings *Species level risk elements* <img src="20190320_MAFMC_SSC_Gaichas_images/sptable2019.png" width="95%" style="display: block; margin: auto;" /> *Ecosystem level risk elements* <img src="20190320_MAFMC_SSC_Gaichas_images/ecotable2019.png" width="95%" style="display: block; margin: auto;" /> --- ## EAFM Risk Assessment: Risk Rankings without updates *Species and Sector level risk elements* <img src="20190320_MAFMC_SSC_Gaichas_images/mgttable2019.png" width="75%" style="display: block; margin: auto;" /> --- ## SOE 2019: Improvements to reproducibility and provenance * Reporting the information is not enough * Managers appreciate the concise format, but back-end critical for describing collection, analyses, and processing 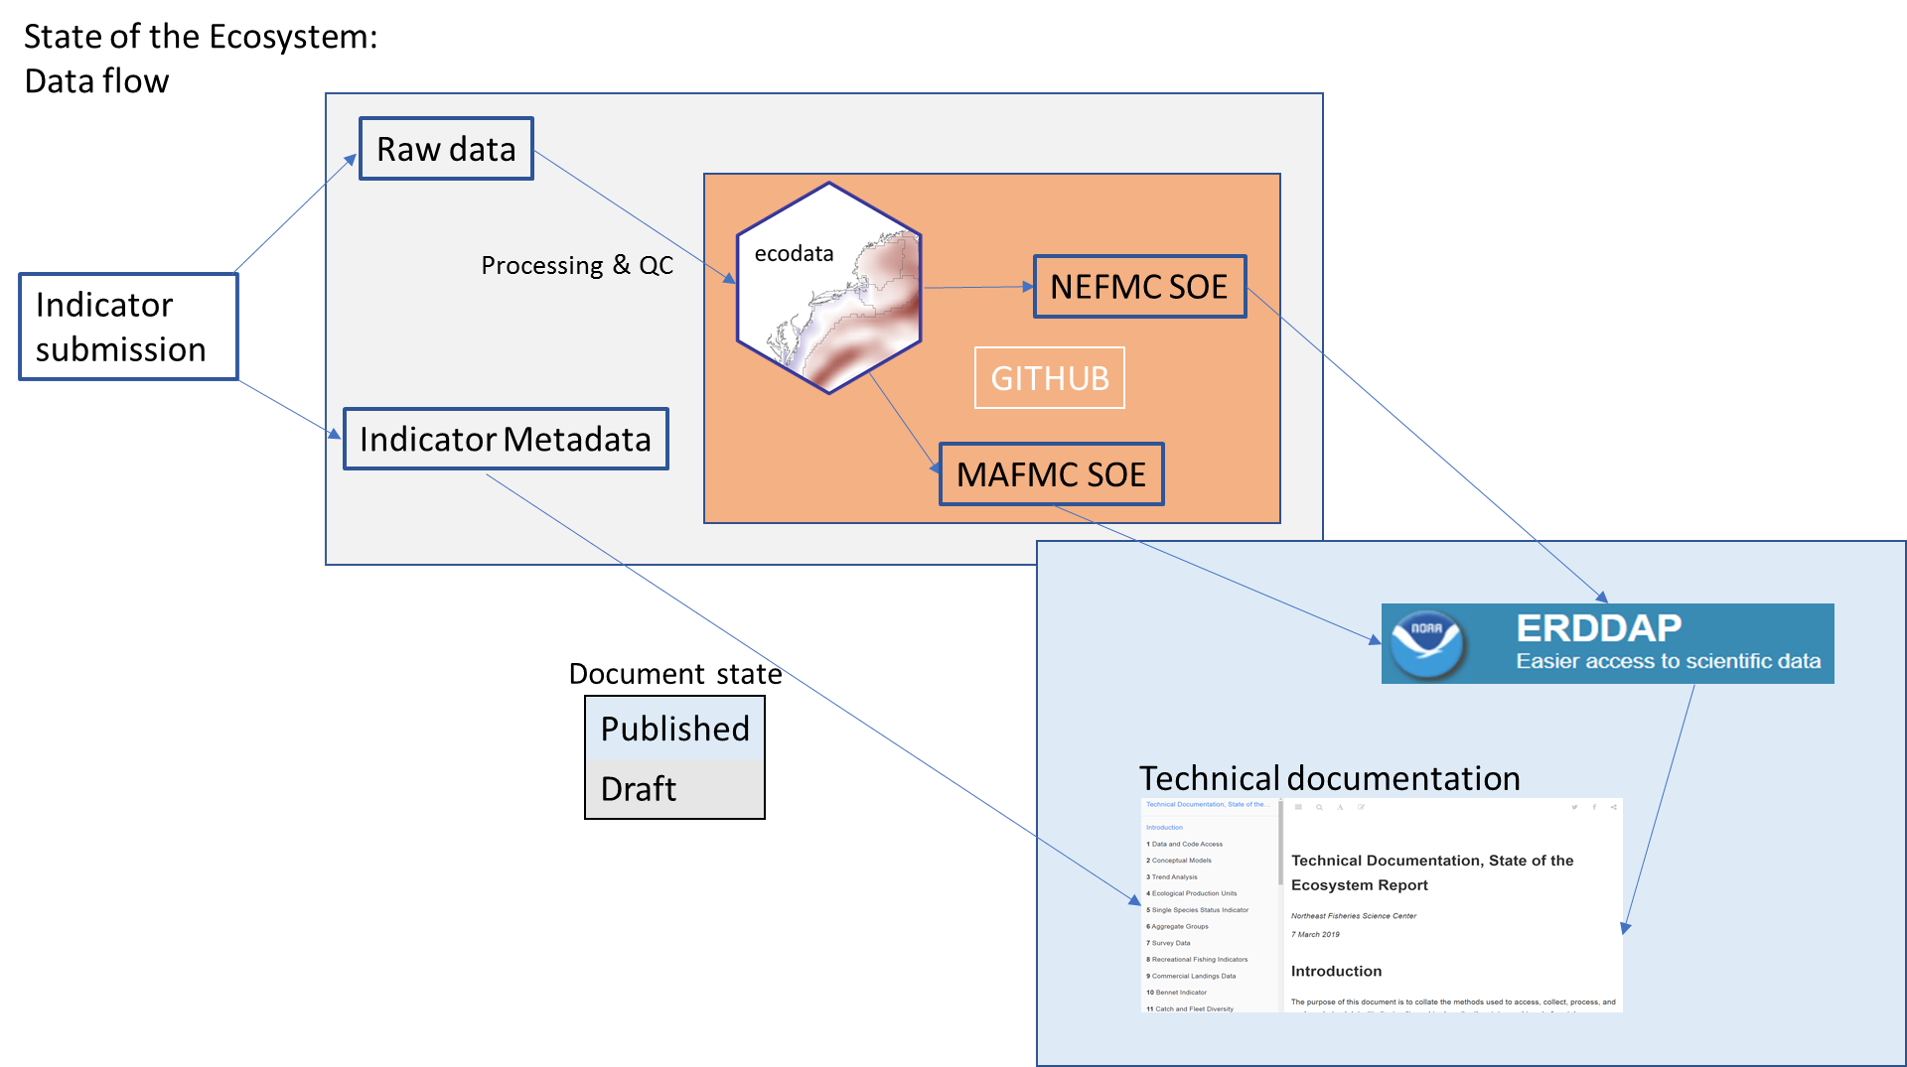 ??? This workflows also ensures that there's no information lost between SOE cycles. We know exactly how a data set was analyzed and handled so that the data can be updated for next year's reports. --- ## External Resources * [SOE Technical Documentation](https://noaa-edab.github.io/tech-doc) * [ecodata R package](https://github.com/noaa-edab/ecodata) * [Macrofauna indicators](http://noaa-edab.github.io/ecodata/macrofauna) * [Human Dimensions indicators](http://noaa-edab.github.io/ecodata/human_dimensions) * [Lower trophic level indicators](http://noaa-edab.github.io/ecodata/LTL) * [ERDDAP server](https://comet.nefsc.noaa.gov/erddap/index.html) * Slides available at https://sgaichas.github.io/soe-presentation --- ## Contributors - THANK YOU! The New England and Mid-Atlantic SOEs made possible by (at least) 38 contributors from 8 intstitutions .pull-left[ .contrib[ Donald Anderson (Woods Hole Oceanographic Institute) <br> Amani Bassyouni (Virginia Department of Health)<br> Lisa Calvo (Rutgers)<br> Matthew Camisa (MA Division of Marine Fisheries) <br> Patricia Clay<br> Lisa Colburn<br> Geret DePiper<br> Deb Duarte<br> Michael Fogarty<br> Paula Fratantoni <br> Kevin Friedland<br> Sarah Gaichas<br> James Gartland (Virginia Institute of Marine Science)<br> Heather Haas<br> Sean Hardison <br> Kimberly Hyde<br> Terry Joyce (Woods Hole Oceanographic Institute)<br> John Kosik<br> Steve Kress (National Audubon Society)<br> Scott Large ] ] .pull-right[ .contrib[ Don Lyons (National Audubon Society)<br> Loren Kellogg<br> David Kulis (Woods Hole Oceanographic Institute)<br> Sean Lucey<br> Chris Melrose<br> Ryan Morse<br> Kimberly Murray<br> Chris Orphanides<br> Richard Pace<br> Charles Perretti<br> Karl Roscher (Maryland Department of Natural Resources)<br> Vincent Saba<br> Laurel Smith<br> Mark Terceiro<br> John Walden<br> Harvey Walsh<br> Mark Wuenschel<br> Qian Zhang (Unversity of Maryland and US EPA Chesapeake Bay Program) ] ] <img src="20190320_MAFMC_SSC_Gaichas_images/noaa-iea.png" width="50%" style="display: block; margin: auto;" /> --- ## Appendix: General feeding guilds <table class="table table-striped table-hover" style="margin-left: auto; margin-right: auto;"> <thead> <tr> <th style="text-align:left;"> Feeding.guild </th> <th style="text-align:left;"> Description </th> <th style="text-align:left;"> Examples </th> </tr> </thead> <tbody> <tr> <td style="text-align:left;"> Apex Predator </td> <td style="text-align:left;"> Top of food chain </td> <td style="text-align:left;"> Shark spp, swordfish </td> </tr> <tr> <td style="text-align:left;"> Piscivore </td> <td style="text-align:left;"> Fish eaters </td> <td style="text-align:left;"> Atlantic cod, spiny dogfish </td> </tr> <tr> <td style="text-align:left;"> Planktivore </td> <td style="text-align:left;"> Zooplankton eaters </td> <td style="text-align:left;"> Atlantic herring </td> </tr> <tr> <td style="text-align:left;"> Benthivore </td> <td style="text-align:left;"> Feed on bottom </td> <td style="text-align:left;"> Lobster, black sea bass </td> </tr> <tr> <td style="text-align:left;"> Benthos </td> <td style="text-align:left;"> Things that live on bottom </td> <td style="text-align:left;"> Sea scallop, urchins </td> </tr> </tbody> </table> --- ## Appendix: Ocean circulation <img src="20190320_MAFMC_SSC_Gaichas_images/nw-atlantic-circ.jpg" width="50%" style="display: block; margin: auto;" /> .footnote[ Townsend, D. W., Pettigrew, N. R., Thomas, M. A., Neary, M. G., McGillidcuddy, D. J., O'Donnell, J (2015), Water masses and nutrient sources to the Gulf of Maine, Journal of Marine Research, 73: 93-122. ] ??? Regional currents are major influencers of ocean temperatures in the NW Atlantic The Gulf Stream is a reliable indicator of bottom water temps An offshoot of the gulf stream is the warm slope water, which makes its way into gulf of maine through the northeast channel --- ## Appendix: Ocean circulation changes Which brings us back to... <img src="20190320_MAFMC_SSC_Gaichas_files/figure-html/gsi_sw-1.png" style="display: block; margin: auto;" /> ??? Over the past few years, we've seen a strong departure of the gulf stream north wall from it's mean latitude With that comes a larger percentage of warm slope water entering into gulf of maine through the NE channel --- ## Appendix: Common tern diet diversity .pull-left[ * Warmer waters affect vertical distribution of prey species * Results in more generalist diet choices * High diet diversity in past decade may be the result of decreases in preferred prey type (hake, sandlance) ] .pull-right[ 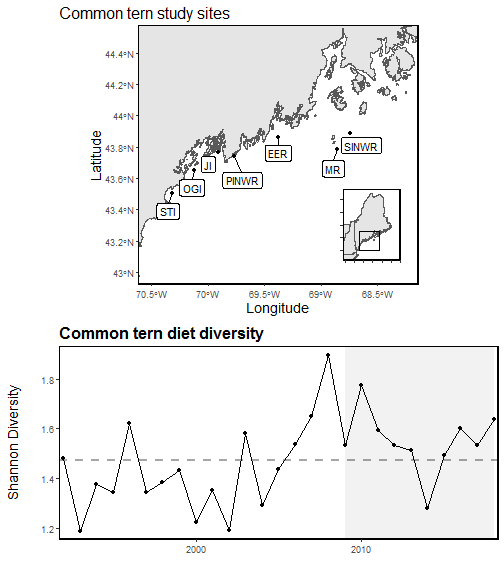<!-- --> ] --- ## Appendix: Common tern diet * Warmer waters result in *butterfish* appearing in common tern diet * May cause starvation or require parents to increase foraging effort * High diet diversity in past decade may be the result of decreases in preferred prey type (hake, sandlance) <div id="htmlwidget-de1e3ae450ee563b13ee" style="width:100%;height:360px;" class="plotly html-widget"></div> <script type="application/json" data-for="htmlwidget-de1e3ae450ee563b13ee">{"x":{"data":[{"orientation":"v","width":0.900000000000091,"base":0.805536332179931,"x":[1990],"y":[0.127335640138408],"text":"Time: 1990<br />Freq: 0.12733564<br />Prey: Amphipod","type":"bar","marker":{"autocolorscale":false,"color":"rgba(166,206,227,1)","line":{"width":1.88976377952756,"color":"transparent"}},"name":"Amphipod","legendgroup":"Amphipod","showlegend":true,"xaxis":"x","yaxis":"y","hoverinfo":"text","frame":null},{"orientation":"v","width":[0.900000000000091,0.900000000000091,0.900000000000091,0.900000000000091,0.900000000000091],"base":[0.780034324942792,0.791870467195143,0.692147252059652,0.611580726965342,0.826251303441084],"x":[1996,2009,2010,2011,2018],"y":[0.134010297482838,0.129026817338506,0.121597663989989,0.223584108199493,0.0858967674661105],"text":["Time: 1996<br />Freq: 0.13401030<br />Prey: Butterfish","Time: 2009<br />Freq: 0.12902682<br />Prey: Butterfish","Time: 2010<br />Freq: 0.12159766<br />Prey: Butterfish","Time: 2011<br />Freq: 0.22358411<br />Prey: Butterfish","Time: 2018<br />Freq: 0.08589677<br />Prey: Butterfish"],"type":"bar","marker":{"autocolorscale":false,"color":"rgba(31,120,180,1)","line":{"width":1.88976377952756,"color":"transparent"}},"name":"Butterfish","legendgroup":"Butterfish","showlegend":true,"xaxis":"x","yaxis":"y","hoverinfo":"text","frame":null},{"orientation":"v","width":[0.900000000000091,0.900000000000091,0.900000000000091,0.900000000000091],"base":[0.736727724309221,0.510052447552448,0.713475866537091,0.781701933323185],"x":[2004,2005,2006,2008],"y":[0.186588016144055,0.308129370629371,0.124068675089083,0.0712437205054042],"text":["Time: 2004<br />Freq: 0.18658802<br />Prey: Euphausiid","Time: 2005<br />Freq: 0.30812937<br />Prey: Euphausiid","Time: 2006<br />Freq: 0.12406868<br />Prey: Euphausiid","Time: 2008<br />Freq: 0.07124372<br />Prey: Euphausiid"],"type":"bar","marker":{"autocolorscale":false,"color":"rgba(178,223,138,1)","line":{"width":1.88976377952756,"color":"transparent"}},"name":"Euphausiid","legendgroup":"Euphausiid","showlegend":true,"xaxis":"x","yaxis":"y","hoverinfo":"text","frame":null},{"orientation":"v","width":[0.900000000000091,0.900000000000091,0.900000000000091,0.900000000000091,0.900000000000091,0.900000000000091,0.900000000000091,0.900000000000091,0.900000000000091,0.900000000000091,0.900000000000091,0.900000000000091,0.900000000000091,0.900000000000091,0.900000000000091,0.900000000000091,0.900000000000091,0.900000000000091,0.900000000000091,0.900000000000091,0.900000000000091,0.900000000000091,0.900000000000091,0.900000000000091,0.900000000000091,0.900000000000091,0.900000000000091,0.900000000000091,0.900000000000091,0.900000000000091,0.900000000000091],"base":[0.619233776387803,0.616067653276956,0.406228373702422,0.581683168316832,0.678194993412385,0.699858423784804,0.629157080108764,0.533014354066986,0.45866704805492,0.489579524680073,0.606304347826087,0.643660130718954,0.69429298436932,0.704302925989673,0.843827819281394,0.528225024248303,0.477336230984166,0.131993006993007,0.391804340783933,0.449986663110163,0.608007307048257,0.674481362793051,0.440713317342789,0.238799661876585,0.716390138005892,0.56510889292196,0.74743452289784,0.703963666391412,0.539637693202593,0.746738296239447,0.619134515119917],"x":[1988,1989,1990,1991,1992,1993,1994,1995,1996,1997,1998,1999,2000,2001,2002,2003,2004,2005,2006,2007,2008,2009,2010,2011,2012,2013,2014,2015,2016,2017,2018],"y":[0.268960125097733,0.33107822410148,0.399307958477509,0.360354785478548,0.269104084321476,0.255545068428504,0.252457644844175,0.398883572567783,0.321367276887872,0.43436928702011,0.340652173913043,0.290457516339869,0.242457288258815,0.214457831325301,0.122376378512985,0.387584869059166,0.259391493325054,0.378059440559441,0.321671525753158,0.349959989330488,0.173694626274928,0.117389104402091,0.251433934716863,0.372781065088757,0.127771747557761,0.312386569872958,0.173686628886506,0.203826039086155,0.284360977231178,0.169224865694551,0.207116788321168],"text":["Time: 1988<br />Freq: 0.26896013<br />Prey: Hake","Time: 1989<br />Freq: 0.33107822<br />Prey: Hake","Time: 1990<br />Freq: 0.39930796<br />Prey: Hake","Time: 1991<br />Freq: 0.36035479<br />Prey: Hake","Time: 1992<br />Freq: 0.26910408<br />Prey: Hake","Time: 1993<br />Freq: 0.25554507<br />Prey: Hake","Time: 1994<br />Freq: 0.25245764<br />Prey: Hake","Time: 1995<br />Freq: 0.39888357<br />Prey: Hake","Time: 1996<br />Freq: 0.32136728<br />Prey: Hake","Time: 1997<br />Freq: 0.43436929<br />Prey: Hake","Time: 1998<br />Freq: 0.34065217<br />Prey: Hake","Time: 1999<br />Freq: 0.29045752<br />Prey: Hake","Time: 2000<br />Freq: 0.24245729<br />Prey: Hake","Time: 2001<br />Freq: 0.21445783<br />Prey: Hake","Time: 2002<br />Freq: 0.12237638<br />Prey: Hake","Time: 2003<br />Freq: 0.38758487<br />Prey: Hake","Time: 2004<br />Freq: 0.25939149<br />Prey: Hake","Time: 2005<br />Freq: 0.37805944<br />Prey: Hake","Time: 2006<br />Freq: 0.32167153<br />Prey: Hake","Time: 2007<br />Freq: 0.34995999<br />Prey: Hake","Time: 2008<br />Freq: 0.17369463<br />Prey: Hake","Time: 2009<br />Freq: 0.11738910<br />Prey: Hake","Time: 2010<br />Freq: 0.25143393<br />Prey: Hake","Time: 2011<br />Freq: 0.37278107<br />Prey: Hake","Time: 2012<br />Freq: 0.12777175<br />Prey: Hake","Time: 2013<br />Freq: 0.31238657<br />Prey: Hake","Time: 2014<br />Freq: 0.17368663<br />Prey: Hake","Time: 2015<br />Freq: 0.20382604<br />Prey: Hake","Time: 2016<br />Freq: 0.28436098<br />Prey: Hake","Time: 2017<br />Freq: 0.16922487<br />Prey: Hake","Time: 2018<br />Freq: 0.20711679<br />Prey: Hake"],"type":"bar","marker":{"autocolorscale":false,"color":"rgba(51,160,44,1)","line":{"width":1.88976377952756,"color":"transparent"}},"name":"Hake","legendgroup":"Hake","showlegend":true,"xaxis":"x","yaxis":"y","hoverinfo":"text","frame":null},{"orientation":"v","width":[0.900000000000091,0.900000000000091,0.900000000000091,0.900000000000091,0.900000000000091,0.900000000000091,0.900000000000091,0.900000000000091,0.900000000000091,0.900000000000091,0.900000000000091,0.900000000000091,0.900000000000091,0.900000000000091,0.900000000000091,0.900000000000091,0.900000000000091,0.900000000000091,0.900000000000091,0.900000000000091,0.900000000000091,0.900000000000091,0.900000000000091,0.900000000000091,0.900000000000091,0.900000000000091,0.900000000000091,0.900000000000091,0.900000000000091,0.900000000000091,0.900000000000091],"base":[0.226739640344019,0.443551797040169,0.257439446366782,0.193275577557756,0.371541501976285,0.199150542708825,0.330683957331102,0.193141945773525,0.315074370709382,0.313345521023766,0.419565217391304,0.452287581699346,0.436932024718284,0.341135972461274,0.670935610103166,0.286517943743938,0.241850357031978,0.065777972027972,0.151441528992549,0.248066150973593,0.41954635408738,0.257884972170686,0.285535509437898,0.0682586644125106,0.216312606605675,0.346415607985481,0.338796140297136,0.544040737682356,0.329898620575037,0.439242773087746,0.313347236704901],"x":[1988,1989,1990,1991,1992,1993,1994,1995,1996,1997,1998,1999,2000,2001,2002,2003,2004,2005,2006,2007,2008,2009,2010,2011,2012,2013,2014,2015,2016,2017,2018],"y":[0.392494136043784,0.172515856236786,0.14878892733564,0.388407590759076,0.3066534914361,0.500707881075979,0.298473122777662,0.339872408293461,0.143592677345538,0.176234003656307,0.186739130434783,0.191372549019608,0.257360959651036,0.363166953528399,0.172892209178228,0.241707080504365,0.235485873952189,0.0662150349650349,0.240362811791383,0.20192051213657,0.188460952960877,0.416596390622365,0.155177807904891,0.170540997464074,0.500077531400217,0.218693284936479,0.408638382600705,0.159922928709056,0.209739072627555,0.307495523151701,0.305787278415016],"text":["Time: 1988<br />Freq: 0.39249414<br />Prey: Herring","Time: 1989<br />Freq: 0.17251586<br />Prey: Herring","Time: 1990<br />Freq: 0.14878893<br />Prey: Herring","Time: 1991<br />Freq: 0.38840759<br />Prey: Herring","Time: 1992<br />Freq: 0.30665349<br />Prey: Herring","Time: 1993<br />Freq: 0.50070788<br />Prey: Herring","Time: 1994<br />Freq: 0.29847312<br />Prey: Herring","Time: 1995<br />Freq: 0.33987241<br />Prey: Herring","Time: 1996<br />Freq: 0.14359268<br />Prey: Herring","Time: 1997<br />Freq: 0.17623400<br />Prey: Herring","Time: 1998<br />Freq: 0.18673913<br />Prey: Herring","Time: 1999<br />Freq: 0.19137255<br />Prey: Herring","Time: 2000<br />Freq: 0.25736096<br />Prey: Herring","Time: 2001<br />Freq: 0.36316695<br />Prey: Herring","Time: 2002<br />Freq: 0.17289221<br />Prey: Herring","Time: 2003<br />Freq: 0.24170708<br />Prey: Herring","Time: 2004<br />Freq: 0.23548587<br />Prey: Herring","Time: 2005<br />Freq: 0.06621503<br />Prey: Herring","Time: 2006<br />Freq: 0.24036281<br />Prey: Herring","Time: 2007<br />Freq: 0.20192051<br />Prey: Herring","Time: 2008<br />Freq: 0.18846095<br />Prey: Herring","Time: 2009<br />Freq: 0.41659639<br />Prey: Herring","Time: 2010<br />Freq: 0.15517781<br />Prey: Herring","Time: 2011<br />Freq: 0.17054100<br />Prey: Herring","Time: 2012<br />Freq: 0.50007753<br />Prey: Herring","Time: 2013<br />Freq: 0.21869328<br />Prey: Herring","Time: 2014<br />Freq: 0.40863838<br />Prey: Herring","Time: 2015<br />Freq: 0.15992293<br />Prey: Herring","Time: 2016<br />Freq: 0.20973907<br />Prey: Herring","Time: 2017<br />Freq: 0.30749552<br />Prey: Herring","Time: 2018<br />Freq: 0.30578728<br />Prey: Herring"],"type":"bar","marker":{"autocolorscale":false,"color":"rgba(251,154,153,1)","line":{"width":1.88976377952756,"color":"transparent"}},"name":"Herring","legendgroup":"Herring","showlegend":true,"xaxis":"x","yaxis":"y","hoverinfo":"text","frame":null},{"orientation":"v","width":[0.900000000000091,0.900000000000091,0.900000000000091,0.900000000000091,0.900000000000091],"base":[0.336575052854123,0.168858131487889,0.366739130434783,0.612237637851298,0.336124219820368],"x":[1989,1990,1998,2002,2008],"y":[0.106976744186047,0.0885813148788928,0.0528260869565217,0.0586979722518677,0.0834221342670117],"text":["Time: 1989<br />Freq: 0.10697674<br />Prey: Other Invertebrate","Time: 1990<br />Freq: 0.08858131<br />Prey: Other Invertebrate","Time: 1998<br />Freq: 0.05282609<br />Prey: Other Invertebrate","Time: 2002<br />Freq: 0.05869797<br />Prey: Other Invertebrate","Time: 2008<br />Freq: 0.08342213<br />Prey: Other Invertebrate"],"type":"bar","marker":{"autocolorscale":false,"color":"rgba(227,26,28,1)","line":{"width":1.88976377952756,"color":"transparent"}},"name":"Other Invertebrate","legendgroup":"Other Invertebrate","showlegend":true,"xaxis":"x","yaxis":"y","hoverinfo":"text","frame":null},{"orientation":"v","width":[0.900000000000091,0.900000000000091,0.900000000000091,0.900000000000091],"base":[0.12046204620462,0.151515151515152,0.39921568627451,0.207565470417071],"x":[1991,1992,1999,2003],"y":[0.0728135313531353,0.220026350461133,0.0530718954248366,0.0789524733268671],"text":["Time: 1991<br />Freq: 0.07281353<br />Prey: Pollock","Time: 1992<br />Freq: 0.22002635<br />Prey: Pollock","Time: 1999<br />Freq: 0.05307190<br />Prey: Pollock","Time: 2003<br />Freq: 0.07895247<br />Prey: Pollock"],"type":"bar","marker":{"autocolorscale":false,"color":"rgba(253,191,111,1)","line":{"width":1.88976377952756,"color":"transparent"}},"name":"Pollock","legendgroup":"Pollock","showlegend":true,"xaxis":"x","yaxis":"y","hoverinfo":"text","frame":null},{"orientation":"v","width":[0.900000000000091,0.900000000000091,0.900000000000091,0.900000000000091,0.900000000000091,0.900000000000091,0.900000000000091,0.900000000000091,0.900000000000091,0.900000000000091,0.900000000000091,0.900000000000091,0.900000000000091,0.900000000000091,0.900000000000091,0.900000000000091,0.900000000000091,0.900000000000091,0.900000000000091,0.900000000000091,0.900000000000091,0.900000000000091,0.900000000000091,0.900000000000091,0.900000000000091,0.900000000000091],"base":[0.139953088350274,0.236786469344609,0.100346020761246,0.121755545068429,0.204559715540682,0.0905901116427432,0.155892448512586,0.126691042047532,0.121739130434783,0.181176470588235,0.0850599781897492,0.15249569707401,0.119530416221985,0.1454898157129,0.180378764358895,0.150440117364631,0.14492312376313,0.182661494349806,0.163520700803003,0.0818731586292448,0.123411978221416,0.172308163577883,0.182769061381778,0.194449060993851,0.221412125863392,0.150808133472367],"x":[1988,1989,1990,1993,1994,1995,1996,1997,1998,1999,2000,2001,2002,2003,2004,2007,2008,2009,2010,2012,2013,2014,2015,2016,2017,2018],"y":[0.0867865519937451,0.0997885835095137,0.0685121107266436,0.0773949976403964,0.12612424179042,0.102551834130782,0.159181922196796,0.186654478976234,0.245,0.218039215686275,0.351872046528535,0.188640275387263,0.492707221629313,0.0620756547041707,0.0614715926730829,0.0976260336089624,0.191201096057239,0.0752234778208804,0.122014808634894,0.13443944797643,0.223003629764065,0.166487976719253,0.361271676300578,0.135449559581187,0.217830647224354,0.162539103232534],"text":["Time: 1988<br />Freq: 0.08678655<br />Prey: Sandlance","Time: 1989<br />Freq: 0.09978858<br />Prey: Sandlance","Time: 1990<br />Freq: 0.06851211<br />Prey: Sandlance","Time: 1993<br />Freq: 0.07739500<br />Prey: Sandlance","Time: 1994<br />Freq: 0.12612424<br />Prey: Sandlance","Time: 1995<br />Freq: 0.10255183<br />Prey: Sandlance","Time: 1996<br />Freq: 0.15918192<br />Prey: Sandlance","Time: 1997<br />Freq: 0.18665448<br />Prey: Sandlance","Time: 1998<br />Freq: 0.24500000<br />Prey: Sandlance","Time: 1999<br />Freq: 0.21803922<br />Prey: Sandlance","Time: 2000<br />Freq: 0.35187205<br />Prey: Sandlance","Time: 2001<br />Freq: 0.18864028<br />Prey: Sandlance","Time: 2002<br />Freq: 0.49270722<br />Prey: Sandlance","Time: 2003<br />Freq: 0.06207565<br />Prey: Sandlance","Time: 2004<br />Freq: 0.06147159<br />Prey: Sandlance","Time: 2007<br />Freq: 0.09762603<br />Prey: Sandlance","Time: 2008<br />Freq: 0.19120110<br />Prey: Sandlance","Time: 2009<br />Freq: 0.07522348<br />Prey: Sandlance","Time: 2010<br />Freq: 0.12201481<br />Prey: Sandlance","Time: 2012<br />Freq: 0.13443945<br />Prey: Sandlance","Time: 2013<br />Freq: 0.22300363<br />Prey: Sandlance","Time: 2014<br />Freq: 0.16648798<br />Prey: Sandlance","Time: 2015<br />Freq: 0.36127168<br />Prey: Sandlance","Time: 2016<br />Freq: 0.13544956<br />Prey: Sandlance","Time: 2017<br />Freq: 0.21783065<br />Prey: Sandlance","Time: 2018<br />Freq: 0.16253910<br />Prey: Sandlance"],"type":"bar","marker":{"autocolorscale":false,"color":"rgba(255,127,0,1)","line":{"width":1.88976377952756,"color":"transparent"}},"name":"Sandlance","legendgroup":"Sandlance","showlegend":true,"xaxis":"x","yaxis":"y","hoverinfo":"text","frame":null},{"orientation":"v","width":[0.900000000000091,0.900000000000091,0.900000000000091,0.900000000000091,0.900000000000091,0.900000000000091,0.900000000000091,0.900000000000091,0.900000000000091,0.900000000000091,0.900000000000091,0.900000000000091,0.900000000000091,0.900000000000091,0.900000000000091,0.900000000000091,0.900000000000091,0.900000000000091,0.900000000000091,0.900000000000091,0.900000000000091,0.900000000000091,0.900000000000091,0.900000000000091,0.900000000000091,0.900000000000091,0.900000000000091,0.900000000000091,0.900000000000091,0.900000000000091,0.900000000000091],"base":[0,0,0,0,0,0,0,0,0,0,0,0,0,0,0,0,0,0,0.0680272108843537,0,0,0,0,0,0,0,0,0,0,0,0],"x":[1988,1989,1990,1991,1992,1993,1994,1995,1996,1997,1998,1999,2000,2001,2002,2003,2004,2005,2006,2007,2008,2009,2010,2011,2012,2013,2014,2015,2016,2017,2018],"y":[0.139953088350274,0.236786469344609,0.100346020761246,0.12046204620462,0.151515151515152,0.121755545068429,0.204559715540682,0.0905901116427432,0.155892448512586,0.126691042047532,0.121739130434783,0.181176470588235,0.0850599781897492,0.15249569707401,0.119530416221985,0.1454898157129,0.180378764358895,0.065777972027972,0.0834143181081957,0.150440117364631,0.14492312376313,0.182661494349806,0.163520700803003,0.0682586644125106,0.0818731586292448,0.123411978221416,0.172308163577883,0.182769061381778,0.194449060993851,0.221412125863392,0.150808133472367],"text":["Time: 1988<br />Freq: 0.13995309<br />Prey: Unknown Fish","Time: 1989<br />Freq: 0.23678647<br />Prey: Unknown Fish","Time: 1990<br />Freq: 0.10034602<br />Prey: Unknown Fish","Time: 1991<br />Freq: 0.12046205<br />Prey: Unknown Fish","Time: 1992<br />Freq: 0.15151515<br />Prey: Unknown Fish","Time: 1993<br />Freq: 0.12175555<br />Prey: Unknown Fish","Time: 1994<br />Freq: 0.20455972<br />Prey: Unknown Fish","Time: 1995<br />Freq: 0.09059011<br />Prey: Unknown Fish","Time: 1996<br />Freq: 0.15589245<br />Prey: Unknown Fish","Time: 1997<br />Freq: 0.12669104<br />Prey: Unknown Fish","Time: 1998<br />Freq: 0.12173913<br />Prey: Unknown Fish","Time: 1999<br />Freq: 0.18117647<br />Prey: Unknown Fish","Time: 2000<br />Freq: 0.08505998<br />Prey: Unknown Fish","Time: 2001<br />Freq: 0.15249570<br />Prey: Unknown Fish","Time: 2002<br />Freq: 0.11953042<br />Prey: Unknown Fish","Time: 2003<br />Freq: 0.14548982<br />Prey: Unknown Fish","Time: 2004<br />Freq: 0.18037876<br />Prey: Unknown Fish","Time: 2005<br />Freq: 0.06577797<br />Prey: Unknown Fish","Time: 2006<br />Freq: 0.08341432<br />Prey: Unknown Fish","Time: 2007<br />Freq: 0.15044012<br />Prey: Unknown Fish","Time: 2008<br />Freq: 0.14492312<br />Prey: Unknown Fish","Time: 2009<br />Freq: 0.18266149<br />Prey: Unknown Fish","Time: 2010<br />Freq: 0.16352070<br />Prey: Unknown Fish","Time: 2011<br />Freq: 0.06825866<br />Prey: Unknown Fish","Time: 2012<br />Freq: 0.08187316<br />Prey: Unknown Fish","Time: 2013<br />Freq: 0.12341198<br />Prey: Unknown Fish","Time: 2014<br />Freq: 0.17230816<br />Prey: Unknown Fish","Time: 2015<br />Freq: 0.18276906<br />Prey: Unknown Fish","Time: 2016<br />Freq: 0.19444906<br />Prey: Unknown Fish","Time: 2017<br />Freq: 0.22141213<br />Prey: Unknown Fish","Time: 2018<br />Freq: 0.15080813<br />Prey: Unknown Fish"],"type":"bar","marker":{"autocolorscale":false,"color":"rgba(202,178,214,1)","line":{"width":1.88976377952756,"color":"transparent"}},"name":"Unknown Fish","legendgroup":"Unknown Fish","showlegend":true,"xaxis":"x","yaxis":"y","hoverinfo":"text","frame":null},{"orientation":"v","width":0.900000000000091,"base":0,"x":[2006],"y":[0.0680272108843537],"text":"Time: 2006<br />Freq: 0.06802721<br />Prey: Unknown Invertebrate","type":"bar","marker":{"autocolorscale":false,"color":"rgba(106,61,154,1)","line":{"width":1.88976377952756,"color":"transparent"}},"name":"Unknown Invertebrate","legendgroup":"Unknown Invertebrate","showlegend":true,"xaxis":"x","yaxis":"y","hoverinfo":"text","frame":null}],"layout":{"margin":{"t":43.7625570776256,"r":7.30593607305936,"b":38.854296388543,"l":47.6214196762142},"paper_bgcolor":"rgba(255,255,255,1)","font":{"color":"rgba(0,0,0,1)","family":"","size":14.6118721461187},"title":"Prey composition","titlefont":{"color":"rgba(0,0,0,1)","family":"","size":17.5342465753425},"xaxis":{"domain":[0,1],"automargin":true,"type":"linear","autorange":false,"range":[1987.231,2018.769],"tickmode":"array","ticktext":["1990","2000","2010"],"tickvals":[1990,2000,2010],"categoryorder":"array","categoryarray":["1990","2000","2010"],"nticks":null,"ticks":"outside","tickcolor":"rgba(51,51,51,1)","ticklen":3.65296803652968,"tickwidth":0.66417600664176,"showticklabels":true,"tickfont":{"color":"rgba(77,77,77,1)","family":"","size":11.689497716895},"tickangle":-0,"showline":false,"linecolor":null,"linewidth":0,"showgrid":false,"gridcolor":null,"gridwidth":0,"zeroline":false,"anchor":"y","title":"Time","titlefont":{"color":"rgba(0,0,0,1)","family":"","size":13.2835201328352},"hoverformat":".2f"},"yaxis":{"domain":[0,1],"automargin":true,"type":"linear","autorange":false,"range":[-0.048310209889719,1.0145144076841],"tickmode":"array","ticktext":["0.00","0.25","0.50","0.75","1.00"],"tickvals":[0,0.25,0.5,0.75,1],"categoryorder":"array","categoryarray":["0.00","0.25","0.50","0.75","1.00"],"nticks":null,"ticks":"outside","tickcolor":"rgba(51,51,51,1)","ticklen":3.65296803652968,"tickwidth":0.66417600664176,"showticklabels":true,"tickfont":{"color":"rgba(77,77,77,1)","family":"","size":11.689497716895},"tickangle":-0,"showline":false,"linecolor":null,"linewidth":0,"showgrid":false,"gridcolor":null,"gridwidth":0,"zeroline":false,"anchor":"x","title":"Proportion of prey items","titlefont":{"color":"rgba(0,0,0,1)","family":"","size":13.2835201328352},"hoverformat":".2f"},"shapes":[{"type":"rect","fillcolor":"transparent","line":{"color":"rgba(0,0,0,1)","width":0.99626400996264,"linetype":"solid"},"yref":"paper","xref":"paper","x0":0,"x1":1,"y0":0,"y1":1}],"showlegend":true,"legend":{"bgcolor":"rgba(255,255,255,1)","bordercolor":"transparent","borderwidth":1.88976377952756,"font":{"color":"rgba(0,0,0,1)","family":"","size":11.689497716895},"y":0.913385826771654},"annotations":[{"text":"Prey","x":1.02,"y":1,"showarrow":false,"ax":0,"ay":0,"font":{"color":"rgba(0,0,0,1)","family":"","size":14.6118721461187},"xref":"paper","yref":"paper","textangle":-0,"xanchor":"left","yanchor":"bottom","legendTitle":true}],"hovermode":"closest","barmode":"relative"},"config":{"doubleClick":"reset","modeBarButtonsToAdd":[{"name":"Collaborate","icon":{"width":1000,"ascent":500,"descent":-50,"path":"M487 375c7-10 9-23 5-36l-79-259c-3-12-11-23-22-31-11-8-22-12-35-12l-263 0c-15 0-29 5-43 15-13 10-23 23-28 37-5 13-5 25-1 37 0 0 0 3 1 7 1 5 1 8 1 11 0 2 0 4-1 6 0 3-1 5-1 6 1 2 2 4 3 6 1 2 2 4 4 6 2 3 4 5 5 7 5 7 9 16 13 26 4 10 7 19 9 26 0 2 0 5 0 9-1 4-1 6 0 8 0 2 2 5 4 8 3 3 5 5 5 7 4 6 8 15 12 26 4 11 7 19 7 26 1 1 0 4 0 9-1 4-1 7 0 8 1 2 3 5 6 8 4 4 6 6 6 7 4 5 8 13 13 24 4 11 7 20 7 28 1 1 0 4 0 7-1 3-1 6-1 7 0 2 1 4 3 6 1 1 3 4 5 6 2 3 3 5 5 6 1 2 3 5 4 9 2 3 3 7 5 10 1 3 2 6 4 10 2 4 4 7 6 9 2 3 4 5 7 7 3 2 7 3 11 3 3 0 8 0 13-1l0-1c7 2 12 2 14 2l218 0c14 0 25-5 32-16 8-10 10-23 6-37l-79-259c-7-22-13-37-20-43-7-7-19-10-37-10l-248 0c-5 0-9-2-11-5-2-3-2-7 0-12 4-13 18-20 41-20l264 0c5 0 10 2 16 5 5 3 8 6 10 11l85 282c2 5 2 10 2 17 7-3 13-7 17-13z m-304 0c-1-3-1-5 0-7 1-1 3-2 6-2l174 0c2 0 4 1 7 2 2 2 4 4 5 7l6 18c0 3 0 5-1 7-1 1-3 2-6 2l-173 0c-3 0-5-1-8-2-2-2-4-4-4-7z m-24-73c-1-3-1-5 0-7 2-2 3-2 6-2l174 0c2 0 5 0 7 2 3 2 4 4 5 7l6 18c1 2 0 5-1 6-1 2-3 3-5 3l-174 0c-3 0-5-1-7-3-3-1-4-4-5-6z"},"click":"function(gd) { \n // is this being viewed in RStudio?\n if (location.search == '?viewer_pane=1') {\n alert('To learn about plotly for collaboration, visit:\\n https://cpsievert.github.io/plotly_book/plot-ly-for-collaboration.html');\n } else {\n window.open('https://cpsievert.github.io/plotly_book/plot-ly-for-collaboration.html', '_blank');\n }\n }"}],"cloud":false},"source":"A","attrs":{"3f7478557666":{"x":{},"y":{},"fill":{},"type":"bar"}},"cur_data":"3f7478557666","visdat":{"3f7478557666":["function (y) ","x"]},"highlight":{"on":"plotly_click","persistent":false,"dynamic":false,"selectize":false,"opacityDim":0.2,"selected":{"opacity":1},"debounce":0},"base_url":"https://plot.ly"},"evals":["config.modeBarButtonsToAdd.0.click"],"jsHooks":[]}</script> ??? * Common tern breeding colonies are monitored in the southern GOM * Common tern sensitive to vertical distribution of prey